|
DB-Design View |
  
|
| Show/Hide Hidden Text |
|
DB-Design View |
|
| Show/Hide Hidden Text |
![]() DB-Design View or Dashboard View is a a Feature of Logic ERP Software that allows you to modify your Dashboard and viewing the report you've designed in DB-Design. You can decide how it will look (Report), but you can't edit or change the data in it. This could be done only in DB-Design.
DB-Design View or Dashboard View is a a Feature of Logic ERP Software that allows you to modify your Dashboard and viewing the report you've designed in DB-Design. You can decide how it will look (Report), but you can't edit or change the data in it. This could be done only in DB-Design.
![]() This option is available in all Reports of Logic ERP Software. Let's have an example of report 'Sales Register-Cross Tab' to understand the way of Viewing Dashboard. It works on the following types of DB Design:
This option is available in all Reports of Logic ERP Software. Let's have an example of report 'Sales Register-Cross Tab' to understand the way of Viewing Dashboard. It works on the following types of DB Design:
![]() Click on Report/ Query and open Sales Register-Cross Tab. A window will appear on your screen. Select your Choice of report from the drop down list of Configuration. Tick on your report and then, Click on the Create button to create the report. Once the report is created close it. Click on DB-Design to design your report. Once you've designed your Dashboard, Click on DB-Design View.
Click on Report/ Query and open Sales Register-Cross Tab. A window will appear on your screen. Select your Choice of report from the drop down list of Configuration. Tick on your report and then, Click on the Create button to create the report. Once the report is created close it. Click on DB-Design to design your report. Once you've designed your Dashboard, Click on DB-Design View.
|
It is compulsory to create Report and then, Creating DB-Design before opening DB-Design View. |
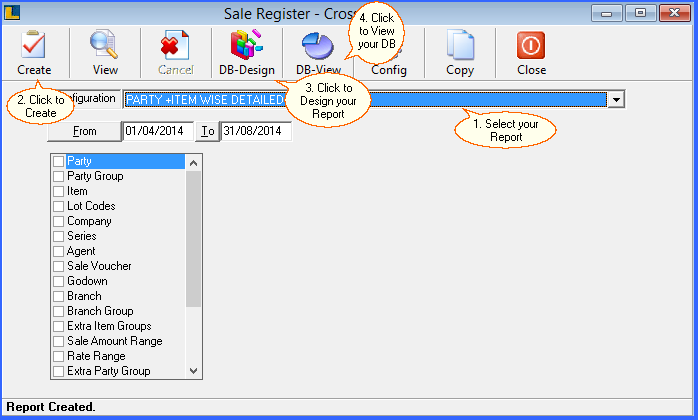
Fig 1. Opening DB- View
![]() Pivot Grid is used to present your data in a concise and comprehensive way with the help of Tables. DB- View allows you to show your data in Pivot Grid with easier way. You can Drag and Drop the items in DB-View.
Pivot Grid is used to present your data in a concise and comprehensive way with the help of Tables. DB- View allows you to show your data in Pivot Grid with easier way. You can Drag and Drop the items in DB-View.
![]() To Drag and Drop the items, Click on the field you want to move and Drag it to your Desired Display Area (Data Field, Filter Field, Row Field or Column Field). You can quickly change the structure of your Table through this method. If you want more changes in your Pivot Grid, open DB-Design. The changes will appear in DB-View as well.
To Drag and Drop the items, Click on the field you want to move and Drag it to your Desired Display Area (Data Field, Filter Field, Row Field or Column Field). You can quickly change the structure of your Table through this method. If you want more changes in your Pivot Grid, open DB-Design. The changes will appear in DB-View as well.
![]() There is a toolbar at the top of the window that provides you the option to Export, Expand All, Collapse All, Best Fit, Print and Expression Field Export items of Pivot grid as per your Requirements.
There is a toolbar at the top of the window that provides you the option to Export, Expand All, Collapse All, Best Fit, Print and Expression Field Export items of Pivot grid as per your Requirements.
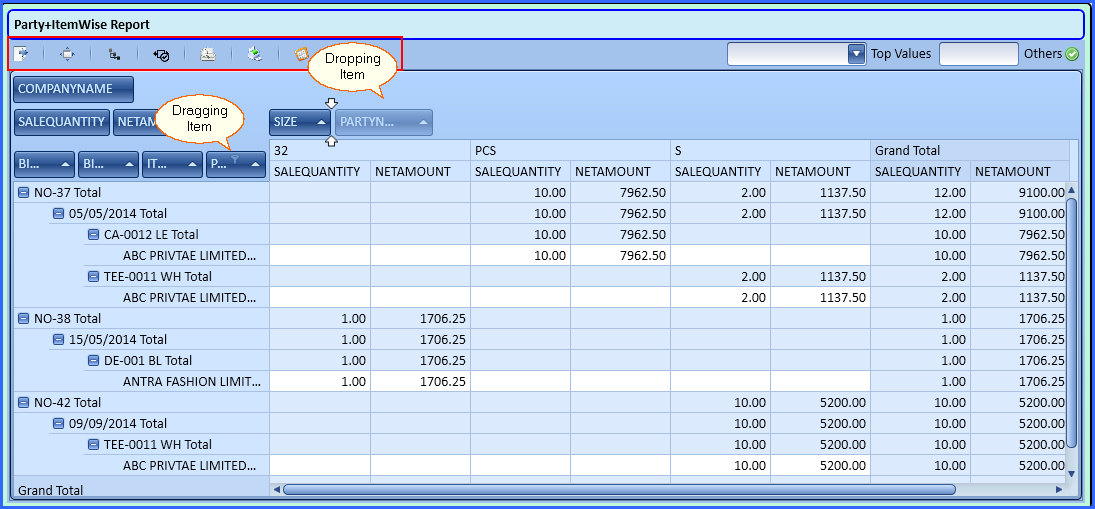
Fig 2. Pivot Grid (DB-View)
|
You can add Filters in Pivot Grid from Filter List.
|
![]() Charts are used to present your data in an attractive form. It is used to show large data in a simple way. There are different types of Chart like; Bar Graph, Pie Chart, Doughnut, Line Chart etc. It is considered more user- Friendly than Pivot Grid or Filter List. Chart allows you to decide the look of the chart as per your wish through Legend, Item Labels, Axis-X, Axis-Y, Title, Grid etc.
Charts are used to present your data in an attractive form. It is used to show large data in a simple way. There are different types of Chart like; Bar Graph, Pie Chart, Doughnut, Line Chart etc. It is considered more user- Friendly than Pivot Grid or Filter List. Chart allows you to decide the look of the chart as per your wish through Legend, Item Labels, Axis-X, Axis-Y, Title, Grid etc.
![]() Data in Chart is represented on Axes. Often, it is used to display large data.
Data in Chart is represented on Axes. Often, it is used to display large data.
![]() You can decide the layout and functioning of your report through DB-Design View. You can also Add Grid to the Chart as well to modify its look further.
You can decide the layout and functioning of your report through DB-Design View. You can also Add Grid to the Chart as well to modify its look further.
![]() The changes that you will make in DB-Design will be seen in DB-Design View as well.
The changes that you will make in DB-Design will be seen in DB-Design View as well.
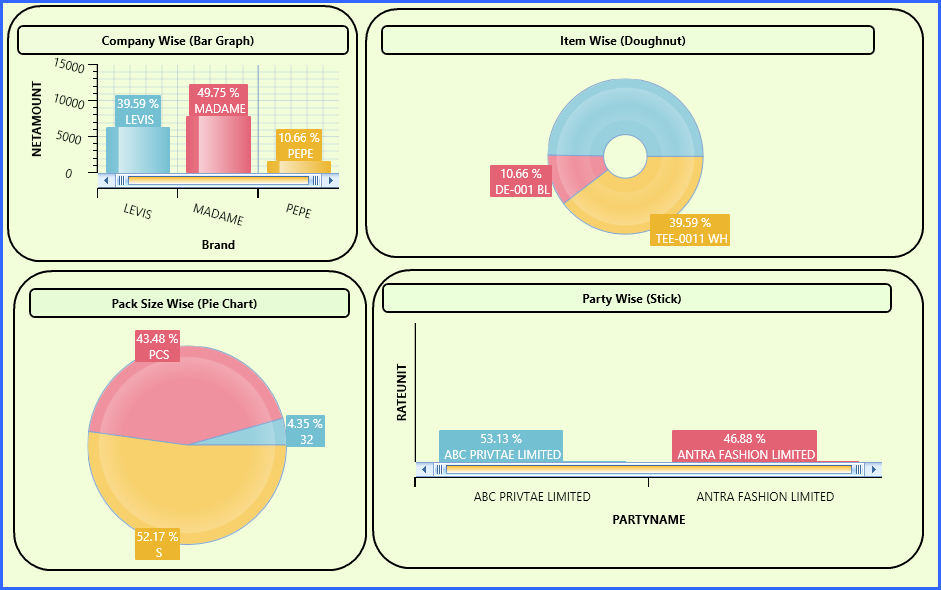
Fig 3. Chart (DB-View)
|
You can add Filters in Chart from Filter List.
|
![]() Drill down Groups are a list of dimensions which allows users to drill down to more detailed levels of the data. You can look after the fields of every level from the topmost to bottom one through this group without creating new Sheet or chart. It saves a lot of time as you don't have to look at each field.
Drill down Groups are a list of dimensions which allows users to drill down to more detailed levels of the data. You can look after the fields of every level from the topmost to bottom one through this group without creating new Sheet or chart. It saves a lot of time as you don't have to look at each field.
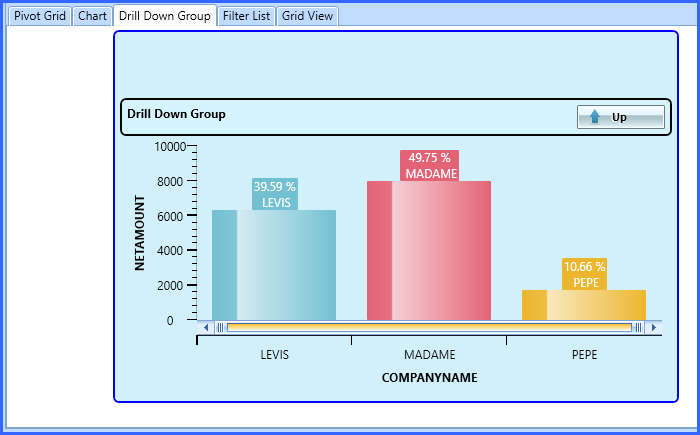
Fig 5. Drill Down Group (DB-View)
![]() Click on any Company to look after its next field of the report. For example: As you Click on Company Name 'Madame', window as seen below will appear on your screen:
Click on any Company to look after its next field of the report. For example: As you Click on Company Name 'Madame', window as seen below will appear on your screen:
![]() By Clicking the Up button in the Title Bar of the Chart, you can see next field of the Chart if exists.
By Clicking the Up button in the Title Bar of the Chart, you can see next field of the Chart if exists.
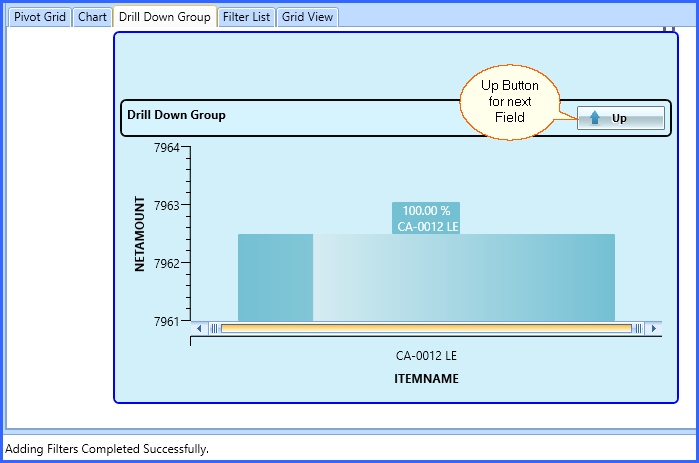
Fig 6. Drill Down Group (DB-View)
|
You can add Filters in Drill Down Group from Filter List.
|
![]() Filters allow you to select the only information that you want to see. Create a list of fields (Filter List) that you want to be displayed in your Report and save your time.
Filters allow you to select the only information that you want to see. Create a list of fields (Filter List) that you want to be displayed in your Report and save your time.
![]() DB-Design View shows the Filter List that you have designed in DB-Design.
DB-Design View shows the Filter List that you have designed in DB-Design.
![]() In the View part, you can custom it according to your needs by clicking on the Custom Checkbox. By Click on, '+' you can add the Filter in Pivot Grid or Chart and by click on '-' you can remove the Filter items. You can remove the filter by removing the Tick from 'Custom' as well.
In the View part, you can custom it according to your needs by clicking on the Custom Checkbox. By Click on, '+' you can add the Filter in Pivot Grid or Chart and by click on '-' you can remove the Filter items. You can remove the filter by removing the Tick from 'Custom' as well.
![]() You can decide it's look from the options available in Properties like; Title Text color, Title border design and Table color etc.
You can decide it's look from the options available in Properties like; Title Text color, Title border design and Table color etc.
![]() The changes you will made in DB-Design will be visible in DB-Design View as well.
The changes you will made in DB-Design will be visible in DB-Design View as well.
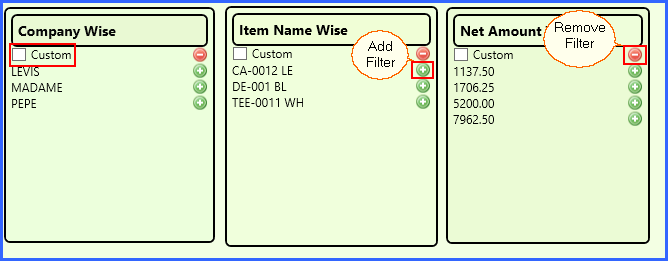
Fig 4. Filter List (DB-View)
|
You can add Filters in Pivot Grid, Chart or Drill Down Groups. |
![]() Below window will appear on your screen if you combine all DB-Design types together to represent data in a comprehensive and detailed manner in a DB-Design View window after modifying these major types of DB-Design.
Below window will appear on your screen if you combine all DB-Design types together to represent data in a comprehensive and detailed manner in a DB-Design View window after modifying these major types of DB-Design.
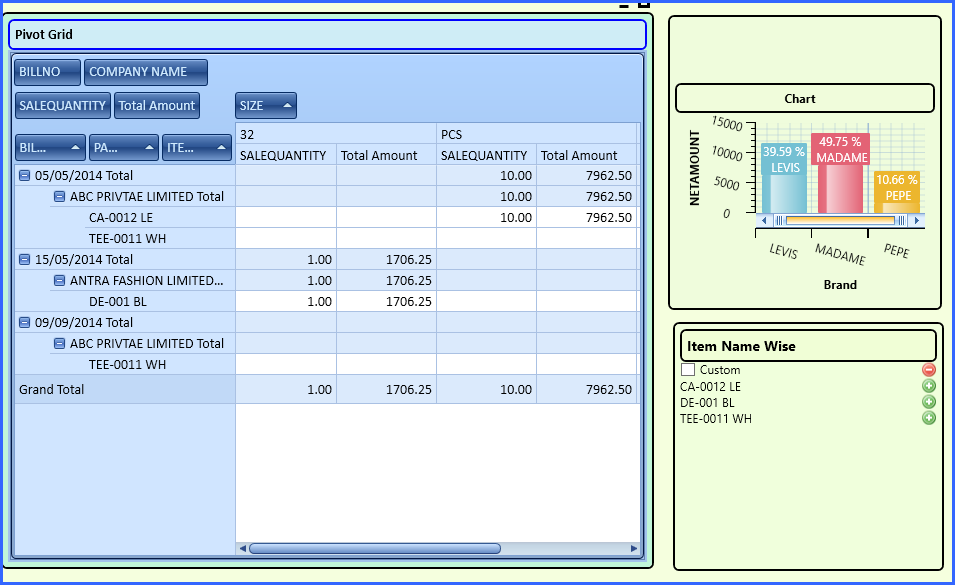
Fig 7. DB- View (Combined)