View Report option added in the Data Entry Grid window
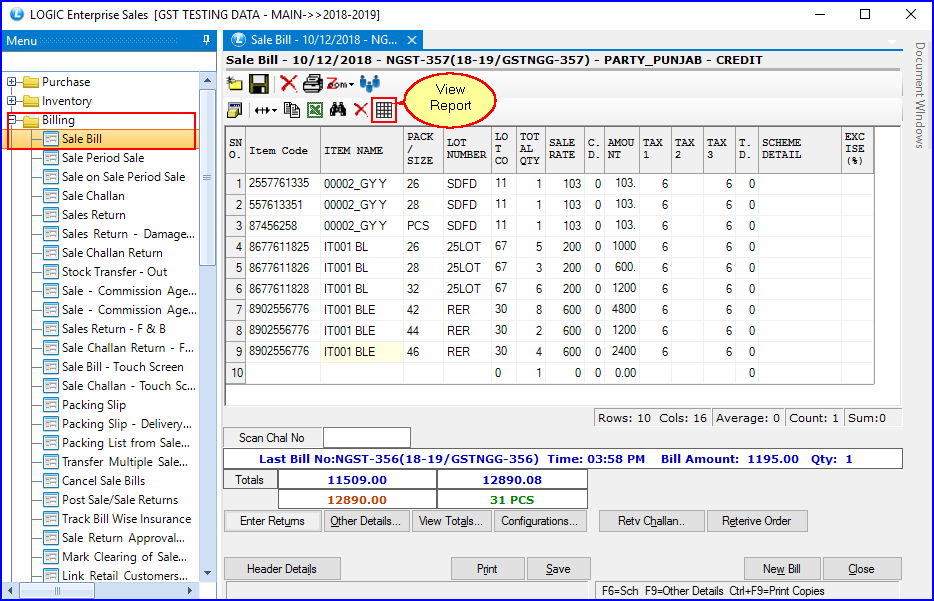
Let us take an example of Sale Bill window. You can see a new icon added as shown in the figure below:
This option enables you to generate the side-by-side report for the items you sold. You can also keep track of the number of items you sold. It enables you to control the list of columns that you want to display in the report.
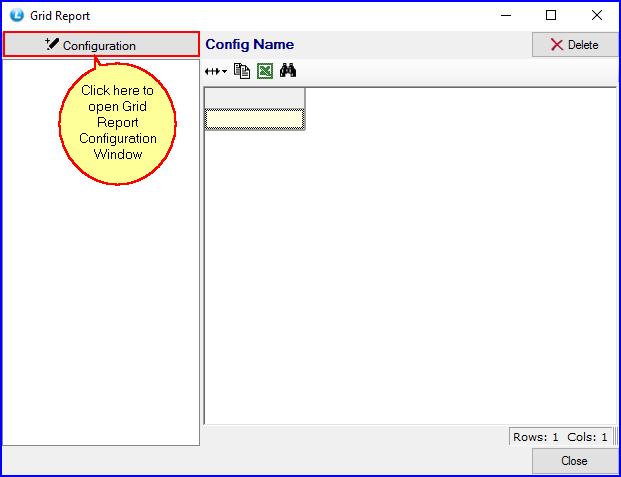
Grid Report Configuration
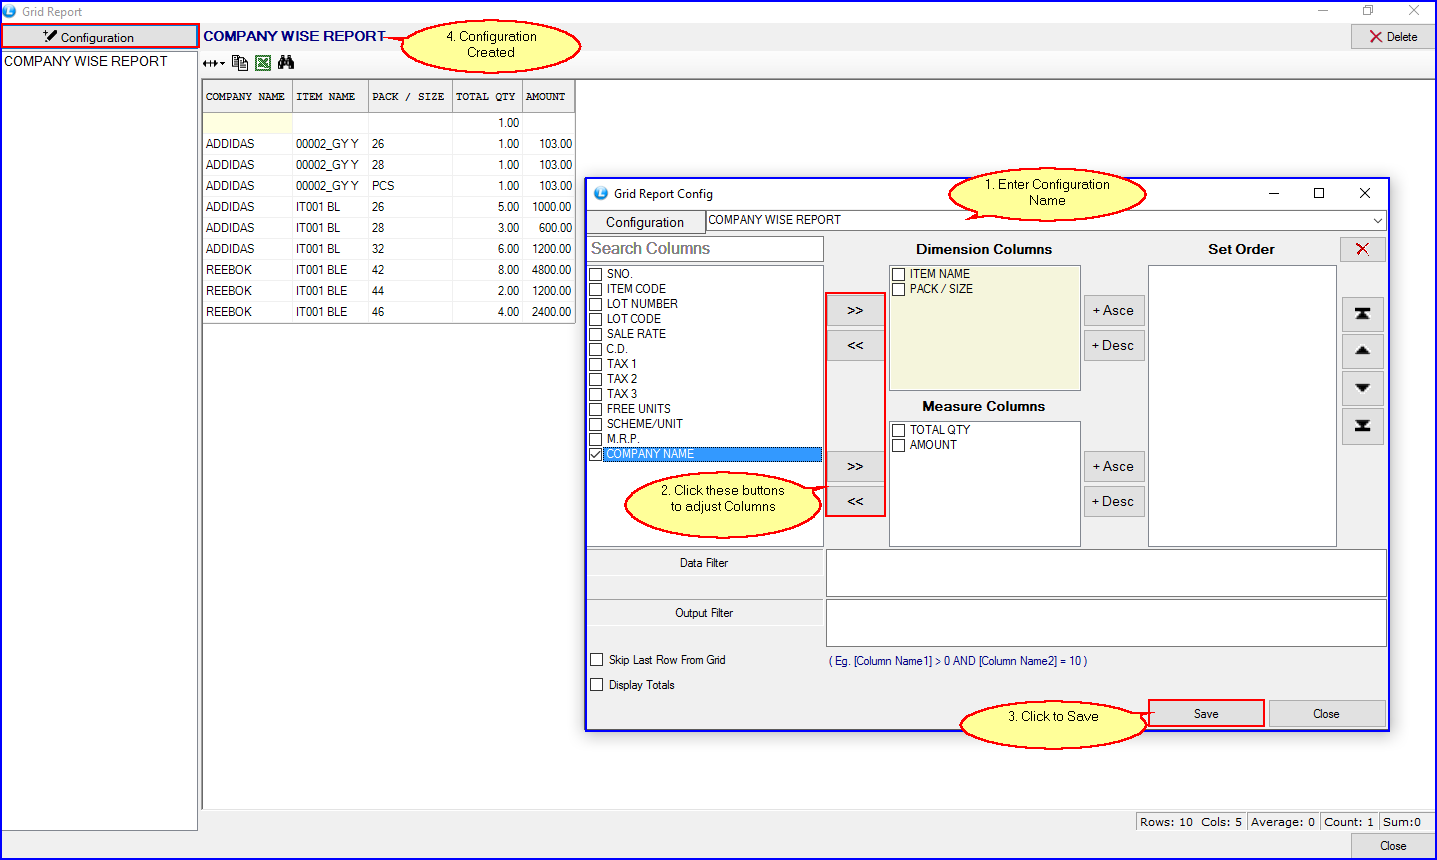
You can set up the configuration of the report in this window.
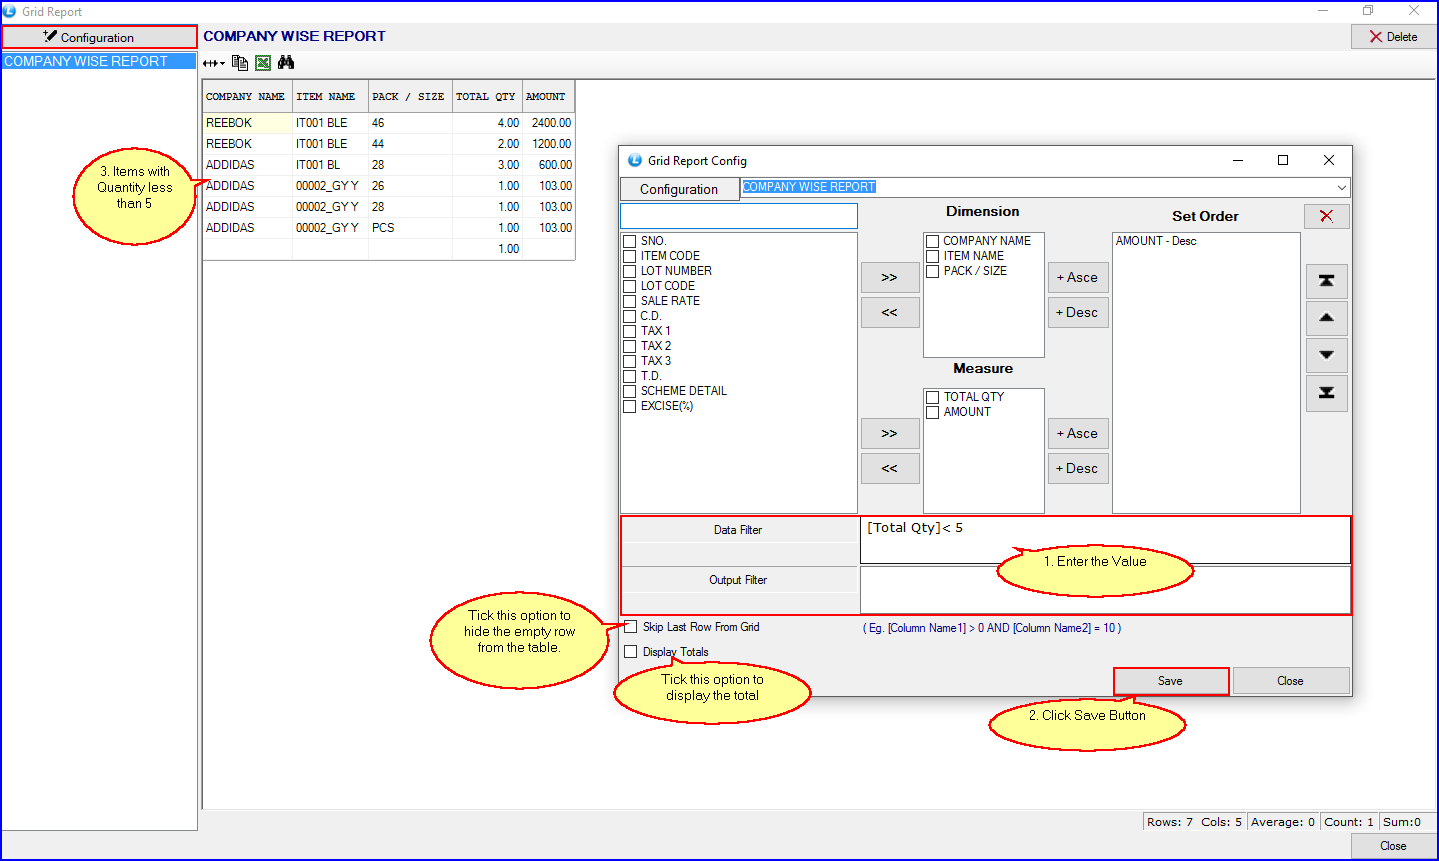
1. In the Dimension box, you can include the columns with simple values such as Item name, company name, etc. In the Measure box, you can include the columns that accept numerical values & can calculate their total like Total Quantity, Amount, etc..
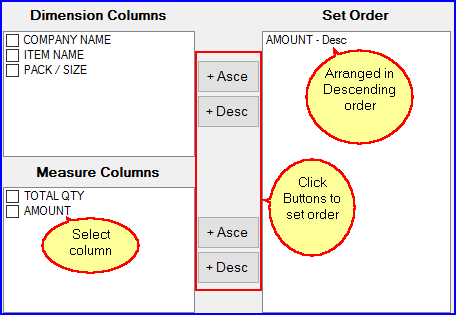
2. In the “Set Order” box, you can include the columns to arrange them in Ascending or Descending order.
3. Let’s assume that you want to display items with quantity less than 5. For this, you can use the data filter and the output filter option. Write the code as explained in the example, and press the “Save” button. The figure below will give you clear sight this feature:
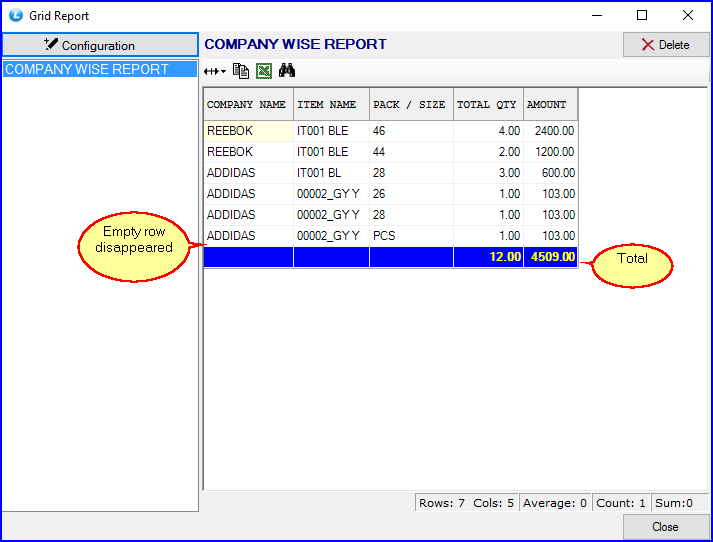
4. Tick the “Skip Last Row From Grid” option to eliminate empty rows from the list. When you tick “Display Totals” options, the total of every column with numerical values will get calculated and displayed in blue color.
