Grocery Retail Analytics: A Complete Guide to Sales Performance, Category Analysis and Store Profitability

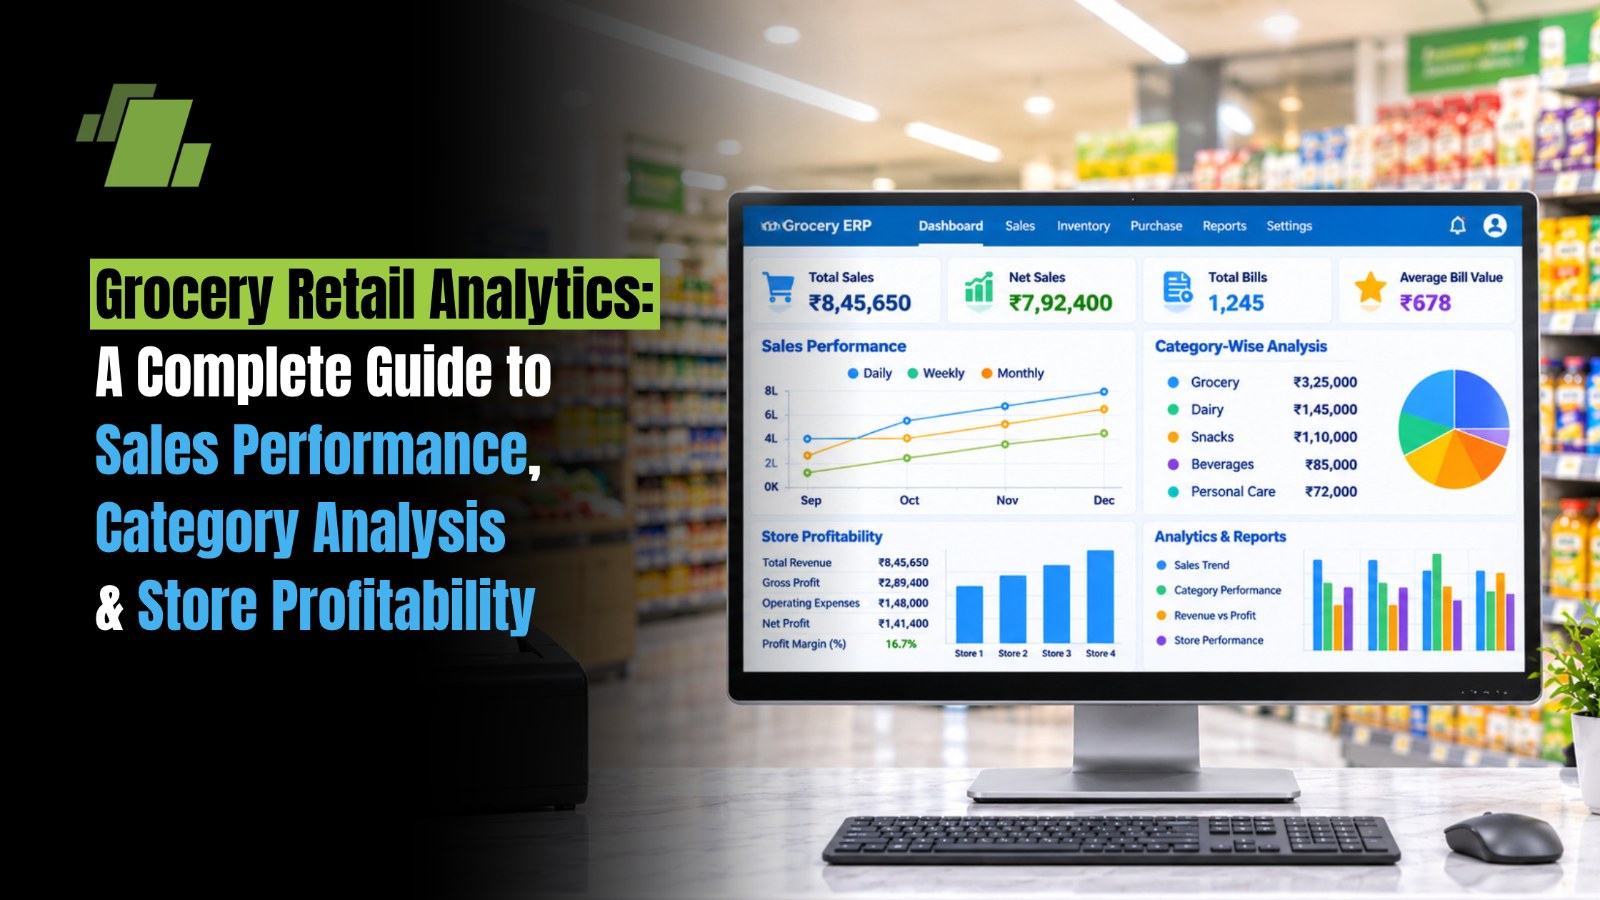
Introduction
Running a profitable grocery retail business requires more than maintaining sufficient inventory and generating daily sales. Grocery retailers deal with thousands of SKUs, changing customer preferences, fluctuating product demand, supplier price variations, promotional offers, seasonal sales patterns and constantly changing operating costs.
Without accurate business data, store owners and managers may struggle to identify which products generate the highest revenue, which categories contribute the most profit, where sales are declining and how inventory decisions affect overall profitability.
This is where grocery retail analytics becomes essential.
Grocery retail analytics involves collecting, analysing and interpreting business data from sales transactions, inventory, purchasing, customer behaviour, pricing and store operations. It helps retailers understand business performance at different levels, including product-wise, category-wise, counter-wise, store-wise and region-wise performance.
With the right grocery store software, retailers can convert everyday operational data into actionable business insights, identify growth opportunities, reduce avoidable losses and make more informed decisions.
In this guide, we will explore how grocery retailers can use sales performance analysis, category analysis, inventory analytics and profitability tracking to improve business performance.
Contact Us
Free Demo Request
What is Grocery Retail Analytics?
Grocery retail analytics is the process of analysing sales, inventory, purchasing, customer transactions and financial data to evaluate and improve the performance of a grocery retail business.
It enables retailers to understand what is selling, when customers are purchasing, which categories are performing well, how much profit individual products generate and where operational inefficiencies exist.
For example, a grocery retailer operating multiple stores can use retail analytics to identify:
-
Which products generate the highest sales revenue.
-
Which grocery categories contribute the most to gross profit.
-
Which products have declining sales or slow inventory movement.
-
Which stores are achieving higher sales and profitability.
-
How discounts and promotional schemes affect profit margins.
-
Which products require replenishment based on sales trends.
-
How much inventory is lying unsold or approaching expiry.
-
Which suppliers offer better purchase rates and margins.
Instead of relying on assumptions or manually prepared reports, retailers can use real-time or regularly updated business data to make informed decisions.
Why is Grocery Retail Analytics Important for Modern Grocery Stores?
Grocery retail operates on high transaction volumes, frequent purchases and relatively tight profit margins. Even small inefficiencies in pricing, purchasing, stock management or promotions can affect overall profitability.
Retail analytics helps address these challenges by providing visibility into business performance.
1. Understand Actual Sales Performance
Daily sales figures alone do not provide a complete picture of business performance.
Retailers need to understand sales by product, category, brand, billing counter, salesperson, store and time period.
Sales analytics helps identify:
-
Best-selling and underperforming products.
-
Daily, weekly and monthly sales trends.
-
Peak shopping hours and high-demand days.
-
Average transaction value.
-
Sales growth compared with previous periods.
-
Revenue contribution from individual categories.
This information helps retailers understand where revenue is coming from and which areas require attention.
2. Improve Category-Wise Profitability
A grocery store may generate significant revenue from a particular category without necessarily earning the highest profit from it.
For example, dairy products may contribute substantial sales but offer different margins compared with packaged foods, personal care or household products.
Category performance analysis helps retailers evaluate both revenue and gross profit, enabling better decisions about product assortment, pricing and promotions.
3. Reduce Inventory Losses
Excess inventory, expired products, dead stock and inaccurate replenishment can reduce grocery store profitability.
Inventory analytics helps retailers identify slow-moving products, monitor stock ageing, analyse stock turnover and improve replenishment decisions.
4. Make Better Purchasing Decisions
Purchase analytics provides visibility into supplier pricing, purchase quantities, product movement and procurement costs.
Retailers can use this information to identify purchasing opportunities, evaluate suppliers and avoid unnecessary stock accumulation.
5. Improve Multi-Store Business Performance
For grocery chains, comparing individual store performance is essential.
Store-wise analytics helps management identify profitable outlets, compare category performance, monitor sales growth and understand differences in operating efficiency.
Key Areas of Grocery Retail Analytics
An effective grocery retail analytics strategy should cover multiple areas of business operations rather than focusing exclusively on sales revenue.
The following are the major areas retailers should monitor.
1. Grocery Sales Performance Analytics
Sales performance analytics measures how effectively a grocery store generates revenue through product sales and customer transactions.
It provides insights into sales trends, product demand, billing performance and revenue contribution.
Important sales performance metrics include:
|
Metric |
What It Measures |
|
Total Sales Revenue |
Overall value of products sold |
|
Net Sales |
Sales after applicable discounts and returns |
|
Sales Growth Rate |
Percentage change in sales over a period |
|
Average Transaction Value |
Average amount spent per bill |
|
Units Sold |
Total quantity of products sold |
|
Product-Wise Sales |
Revenue generated by individual products |
|
Category-Wise Sales |
Revenue generated by product categories |
|
Store-Wise Sales |
Sales contribution from each outlet |
Example:
Suppose a supermarket generates the following monthly sales:
|
Category |
Monthly Sales |
|
Grocery & Staples |
₹12,00,000 |
|
Dairy Products |
₹5,00,000 |
|
Packaged Foods |
₹8,00,000 |
|
Beverages |
₹4,00,000 |
|
Personal Care |
₹6,00,000 |
|
Household Products |
₹5,00,000 |
|
Total |
₹40,00,000 |
This analysis helps management understand which categories contribute the most to overall revenue.
However, sales contribution should also be compared with category-wise gross profit to determine actual business value.
2. Product-Wise Sales Analysis
Product-wise sales analysis helps retailers evaluate the performance of individual SKUs.
A grocery store may stock thousands of products, but their sales contribution and movement patterns can vary significantly.
By analysing product-level data, retailers can identify:
-
Fast-moving products generating consistent demand.
-
Slow-moving products occupying valuable shelf space.
-
Products experiencing declining demand.
-
High-revenue products with low profit margins.
-
Products frequently purchased together.
-
Products requiring price or promotional adjustments.
For example, if a particular packaged food brand generates high sales but contributes relatively low margins, retailers can evaluate alternative brands or negotiate better purchase prices.
Similarly, products with consistent demand and healthy margins can receive greater attention during procurement and shelf planning.
3. Category-Wise Performance Analysis
Category analysis evaluates the performance of different product groups within a grocery store.
Common grocery categories include:
-
Grocery and staples
-
Fruits and vegetables
-
Dairy and bakery
-
Packaged foods
-
Beverages
-
Personal care
-
Home care and household products
-
Frozen foods
-
Snacks and confectionery
-
Baby care products
Category-wise analysis helps retailers understand which departments drive revenue, which generate better margins and which require operational improvements.
For example, a supermarket may discover that packaged foods contribute 20% of revenue but 25% of gross profit, while another category contributes 15% of revenue but only 8% of gross profit.
Such insights can influence category assortment, pricing, supplier negotiations and promotional planning.
4. Grocery Inventory Analytics
Inventory analytics helps retailers understand how efficiently their stock is moving and whether the business is maintaining the right inventory levels.
In grocery retail, inventory management is particularly important because products have different shelf lives, demand patterns, storage requirements and replenishment cycles.
Retailers should analyse:
-
Opening and closing stock.
-
Product-wise stock movement.
-
Fast-moving and slow-moving inventory.
-
Stock ageing and non-moving products.
-
Batch-wise and expiry-wise inventory.
-
Stock availability and stockout frequency.
-
Excess stock and dead stock.
-
Inventory turnover ratio.
-
Stock valuation and inventory holding costs.
Example:
A supermarket may discover that a particular cooking oil brand has 500 units in stock but sells only 40 units per month. Another brand may have just 100 units in stock but sells 150 units monthly.
This indicates that the second product has faster inventory movement and may require more frequent replenishment.
By reviewing these patterns, retailers can reduce unnecessary inventory investment and maintain better product availability.
5. Customer Purchase Behaviour Analytics
Understanding customer purchase behaviour helps grocery retailers improve product assortment, promotions and shopping experiences.
Customer analytics examines transaction patterns to understand what customers purchase, how frequently they shop and how much they spend.
Important areas include:
-
Average bill value.
-
Average items per transaction.
-
Purchase frequency.
-
New versus repeat customers.
-
Customer-wise sales contribution.
-
Frequently purchased product combinations.
-
Category preferences.
-
Response to promotional offers.
-
Customer loyalty and retention.
For example, if transaction analysis shows that customers frequently purchase bread, butter and jam together, retailers can use this information to create relevant product bundles or improve product placement.
Similarly, customer purchase history can help retailers identify shoppers who regularly purchase specific categories and create targeted promotional campaigns.
6. Promotion and Discount Analytics
Discounts and promotional schemes can increase sales volume, attract customers and improve product movement. However, higher sales during a promotional period do not automatically indicate higher profitability.
Retailers must analyse the financial impact of every promotion.
Promotion analytics helps evaluate:
-
Sales before and during a promotion.
-
Additional units sold.
-
Discount value.
-
Gross margin before and after discounts.
-
Promotional sales contribution.
-
Category-wise promotional performance.
-
Return on promotional investment.
-
Impact on regular product sales.
Example:
A grocery retailer offers a 10% discount on a packaged food product.
Before the promotion, the product generates ₹1,00,000 in monthly sales. During the promotion, sales increase to ₹1,30,000.
Although revenue increases by ₹30,000, the retailer must also evaluate the additional discount cost and product margins to determine whether the promotion generated incremental profit.
This prevents retailers from running promotions that increase revenue but negatively affect profitability.
7. Store-Wise and Branch-Wise Analytics
For businesses operating multiple grocery stores, consolidated sales reports are not enough.
Management needs to compare the performance of individual branches to identify differences in revenue, profitability, inventory movement and operational efficiency.
Store-wise analytics provides insights into:
-
Total sales by outlet.
-
Gross profit by store.
-
Category-wise sales by branch.
-
Average transaction value.
-
Inventory turnover by location.
-
Stock availability.
-
Discount and return trends.
-
Purchase and operating expenses.
-
Store-wise sales growth.
For example, if three stores operate in different locations, management may discover that one outlet generates higher revenue but has lower gross margins because of excessive discounting.
Another outlet may generate lower revenue but achieve better inventory turnover and profitability.
These comparisons help management identify operational gaps and replicate successful practices across the retail chain.
8. Supplier and Purchase Analytics
Purchase analytics helps grocery retailers evaluate procurement performance and understand how purchasing decisions influence product costs and margins.
It provides visibility into supplier-wise purchases, product costs, purchase quantities, delivery patterns and outstanding balances.
Retailers can monitor:
-
Supplier-wise purchase value.
-
Product-wise purchase rates.
-
Purchase price variations.
-
Supplier delivery performance.
-
Purchase returns.
-
Purchase discounts and schemes.
-
Outstanding supplier payments.
-
Purchase quantity versus sales demand.
By comparing supplier rates and historical purchase prices, retailers can identify opportunities to negotiate better commercial terms.
Purchase analytics also helps avoid unnecessary procurement by comparing existing stock, pending purchase orders and expected product demand.
Key Grocery Retail Analytics KPIs Every Retailer Should Track
Key Performance Indicators (KPIs) help retailers measure business performance against defined targets.
Rather than tracking every available metric, grocery retailers should focus on KPIs that directly influence sales growth, inventory efficiency and profitability.
The following table highlights important grocery retail analytics KPIs.
|
KPI |
Formula |
Business Purpose |
|
Sales Growth |
(Current Sales − Previous Sales) ÷ Previous Sales × 100 |
Measures revenue growth |
|
Average Transaction Value |
Net Sales ÷ Number of Bills |
Measures average customer spending |
|
Gross Profit |
Net Sales − Cost of Goods Sold |
Measures profit before operating expenses |
|
Gross Profit Margin |
Gross Profit ÷ Net Sales × 100 |
Measures sales profitability |
|
Inventory Turnover |
COGS ÷ Average Inventory at Cost |
Measures stock movement |
|
Sell-Through Rate |
Units Sold ÷ Units Received × 100 |
Measures inventory sales performance |
|
Stockout Rate |
Stockout Events ÷ Total Availability Checks × 100 |
Measures product availability |
|
Discount Percentage |
Total Discounts ÷ Gross Sales × 100 |
Measures discount impact |
|
Shrinkage Rate |
Inventory Loss Value ÷ Net Sales × 100 |
Measures inventory losses |
|
Sales per Square Foot |
Net Sales ÷ Selling Area |
Measures store space productivity |
|
GMROI |
Gross Margin Value ÷ Average Inventory Cost |
Measures return generated by inventory investment |
Note: KPI definitions should be standardised across stores and reporting periods. For example, gross margin and markup are different calculations, and inventory turnover should generally use cost of goods sold divided by average inventory at cost.
These KPIs provide a balanced view of financial performance, inventory productivity and store operations. mindpera.com +3
How to Analyse Grocery Store Profitability
Grocery store profitability cannot be determined by looking at total sales revenue alone. Retailers must evaluate the relationship between selling prices, purchase costs, discounts, inventory losses and operating expenses.
A systematic profitability analysis should cover the following areas.
1. Analyse Gross Profit and Gross Margin
Gross profit indicates the difference between net sales and the cost of goods sold.
2. Evaluate Category-Wise Profit Contribution
Not every grocery category contributes equally to profitability.
Retailers should compare category-wise revenue, purchase cost, discounts and gross margins.
For example:
|
Category |
Net Sales |
Gross Profit |
Gross Margin |
|
Grocery & Staples |
₹5,00,000 |
₹50,000 |
10% |
|
Packaged Foods |
₹3,00,000 |
₹60,000 |
20% |
|
Personal Care |
₹2,00,000 |
₹50,000 |
25% |
|
Total |
₹10,00,000 |
₹1,60,000 |
16% |
Although grocery and staples generate the highest revenue, personal care delivers the highest gross margin percentage.
This comparison helps retailers understand which categories contribute more to gross profit and where pricing, purchasing or assortment improvements may be required.
3. Monitor Inventory Holding Costs
Excess inventory ties up working capital and increases storage and handling requirements.
Retailers should analyse average stock value, inventory turnover, stock ageing and product movement to identify opportunities to optimise inventory investment.
Products with consistently low movement should be reviewed for revised purchasing quantities, promotional strategies or assortment rationalisation.
4. Track Expiry, Damage and Stock Losses
Grocery businesses frequently deal with perishable products and items with limited shelf lives.
Expired, damaged, missing or unsellable inventory directly affects profitability.
Retailers should monitor:
-
Batch-wise expiry dates.
-
Near-expiry stock.
-
Damaged goods.
-
Stock adjustments.
-
Physical versus system stock differences.
-
Product returns and wastage.
Regular analysis helps retailers identify recurring loss patterns and take corrective action.
5. Evaluate Operating Expenses
Gross profit does not represent the final profitability of a grocery store.
Retailers must also account for expenses such as:
-
Employee salaries.
-
Store rent.
-
Electricity and refrigeration.
-
Transportation and logistics.
-
Packaging materials.
-
Maintenance.
-
Marketing and promotions.
-
Other administrative expenses.
Tracking expenses against net sales helps management understand whether the business is generating sufficient operating returns.
6. Calculate Profitability Store-Wise
For grocery chains, profitability should be evaluated separately for every outlet.
A consolidated profit report may hide stores that consistently underperform.
Store-wise profit analysis helps management compare sales, gross margins, operating costs, inventory losses and operating profit across branches.
This makes it easier to identify outlets requiring pricing changes, cost control, better inventory planning or operational improvements.
How Grocery Retail Analytics Helps Improve Business Decisions
The real value of analytics lies in converting reports into practical business decisions.
Here are some ways grocery retailers can use analytical insights to improve day-to-day operations.
1. Identify Fast-Moving and Slow-Moving Products
Product movement analysis helps retailers classify products according to their sales velocity.
Fast-moving products require regular replenishment to avoid stockouts, while slow-moving products may require revised purchasing quantities or promotional strategies.
Retailers can use sales history, stock movement and inventory ageing reports to identify these products.
2. Optimise Product Assortment
A grocery store cannot allocate unlimited shelf space to every product.
Retailers should analyse product-wise sales, margins, customer demand and inventory movement to determine which products deserve greater shelf visibility.
Products with low demand and poor profitability can be reviewed for discontinuation or reduced stock levels.
3. Improve Demand Forecasting
Historical sales data helps retailers identify recurring demand patterns and seasonal fluctuations.
For example, demand for certain grocery products may increase during festivals, summer months, weekends or special promotional periods.
Analysing historical sales trends enables retailers to estimate future requirements and plan purchases more accurately.
4. Improve Pricing Decisions
Product-wise margin analysis helps retailers understand how changes in purchase costs and selling prices affect profitability.
Retailers can identify products with low margins, evaluate competitor pricing and revise selling prices where commercially appropriate.
They can also compare the impact of promotional discounts on sales volume and gross profit.
5. Increase Average Bill Value
Basket analysis helps identify products frequently purchased together.
Retailers can use these insights to:
-
Create product combination offers.
-
Introduce cross-selling promotions.
-
Recommend complementary products.
-
Improve product placement.
-
Develop category-specific offers.
These initiatives can encourage customers to purchase additional products during each shopping visit.
6. Improve Cashier and Billing Counter Performance
Billing analytics provides visibility into transaction volumes, average bill values, cashier-wise sales and peak billing periods.
This information helps store managers evaluate checkout efficiency, allocate staff appropriately and reduce unnecessary waiting time during busy hours.
7. Benchmark Store Performance
Retailers operating multiple outlets can compare business performance against predefined targets.
For example, management can compare monthly sales growth, gross profit margins, category contribution and inventory turnover across branches.
This helps identify best-performing outlets and understand the reasons behind performance differences.
What is a Grocery Retail Analytics Dashboard?
A grocery retail analytics dashboard is a centralised reporting interface that presents important business metrics through charts, graphs, tables and performance indicators.
Instead of reviewing multiple reports individually, retailers can access key business information through a single dashboard.
An effective grocery analytics dashboard should provide the following information:
|
Dashboard |
Important Information |
|
Sales Dashboard |
Daily sales, monthly sales, sales growth and average bill value |
|
Product Dashboard |
Product-wise sales, quantity sold and product contribution |
|
Category Dashboard |
Category-wise revenue, gross profit and margin |
|
Inventory Dashboard |
Stock availability, ageing, fast-moving and slow-moving stock |
|
Purchase Dashboard |
Supplier-wise purchases, purchase rates and purchase trends |
|
Profitability Dashboard |
Gross profit, operating expenses and store-wise profitability |
|
Multi-Store Dashboard |
Branch-wise sales, margins and performance comparisons |
|
Customer Dashboard |
Purchase frequency, average bill value and customer trends |
Features to Look for in Grocery Retail Analytics Software
When selecting grocery retail software, retailers should evaluate whether the solution can provide:
-
Real-time or regularly updated sales reports.
-
Product-wise and category-wise performance analysis.
-
Store-wise and consolidated business reports.
-
Inventory movement and stock ageing analysis.
-
Batch-wise and expiry-wise stock reports.
-
Gross profit and margin analysis.
-
Purchase and supplier performance reports.
-
Cashier-wise and counter-wise sales reports.
-
Customisable business dashboards.
-
Exportable reports for further analysis.
-
Integration with billing, inventory and accounting operations.
The most important consideration is data integration. Analytics becomes more useful when sales, purchasing, inventory and financial information are connected rather than maintained in separate systems.
How to Implement Grocery Retail Analytics in Your Business
Implementing analytics does not necessarily require a complicated transformation. Retailers can begin with the data already generated through their grocery billing and inventory operations.
Follow these steps to establish a practical analytics framework.
Step 1: Centralise Business Data
Collect data from billing, inventory, purchasing, sales returns, customer transactions and accounting operations.
For multi-store businesses, ensure that individual outlets follow consistent data recording and reporting processes.
Step 2: Define Business Objectives
Determine what you want to improve through analytics.
Common objectives include:
-
Increasing monthly sales.
-
Improving category-wise gross margins.
-
Reducing inventory holding costs.
-
Minimising expired and damaged stock.
-
Improving stock availability.
-
Increasing average bill value.
-
Improving store-level profitability.
Step 3: Select Relevant KPIs
Choose KPIs according to your business objectives.
For example, if the objective is to reduce excess inventory, focus on inventory turnover, days of inventory on hand, slow-moving stock and stock ageing.
If the objective is to improve profitability, prioritise gross margin, category-wise profit contribution, discount analysis and operating expenses.
Step 4: Generate Regular Performance Reports
Establish daily, weekly and monthly reporting schedules.
|
Reporting Frequency |
Reports to Review |
|
Daily |
Sales, billing, stockouts, discounts and returns |
|
Weekly |
Product movement, category performance and purchase requirements |
|
Monthly |
Gross margins, inventory turnover, store profitability and sales growth |
|
Quarterly |
Business trends, supplier performance and strategic assortment decisions |
Step 5: Identify Performance Gaps
Compare actual performance with business targets and previous periods.
For example, if a store’s monthly sales have declined, analyse product-wise sales, category performance, customer transactions and stock availability to identify possible reasons.
Step 6: Take Corrective Actions
Use the findings to improve purchasing, inventory replenishment, pricing, promotions and store operations.
Analytics should be part of a continuous improvement process rather than an exercise limited to generating reports.
Step 7: Monitor Results
Track the impact of corrective actions through the same KPIs.
For example, after revising replenishment quantities, monitor inventory turnover, stock availability and stockout frequency to determine whether inventory performance has improved.
Common Challenges in Grocery Retail Analytics
Despite the availability of business data, many grocery retailers struggle to generate meaningful analytical insights.
Some common challenges include:
|
Challenge |
Impact on Business |
Recommended Approach |
|
Scattered business data |
Incomplete performance visibility |
Centralise sales, purchase and inventory data |
|
Manual report preparation |
Delayed business decisions |
Automate routine reporting |
|
Inaccurate inventory records |
Incorrect replenishment decisions |
Maintain accurate stock records and conduct regular stock audits |
|
Limited category visibility |
Difficulty identifying profitable categories |
Implement category-wise sales and margin analysis |
|
No store-wise comparison |
Poor visibility into branch performance |
Use consolidated and outlet-level dashboards |
|
Unstructured product information |
Inconsistent product reporting |
Maintain standardised product and category masters |
|
Lack of historical analysis |
Difficulty identifying sales trends |
Maintain historical business data for comparisons |
|
Revenue-focused decisions |
Overlooking actual profitability |
Evaluate gross margins and operating costs alongside sales |
Addressing these challenges helps retailers establish a reliable foundation for data-driven business management.
How LOGIC ERP Helps Grocery Retailers Improve Business Analytics
Managing a grocery retail business requires connected information across billing, inventory, purchasing, sales and financial operations.
LOGIC ERP provides an integrated ERP solution for grocery retailers, supermarkets and multi-store retail businesses, helping them manage business operations and access meaningful performance insights.
With its grocery retail and supermarket management capabilities, LOGIC ERP helps retailers move beyond basic billing reports and gain better visibility into business performance.
1. Sales Performance Monitoring
Retailers can analyse sales performance through different reporting dimensions, including product-wise, category-wise, store-wise and counter-wise sales.
This helps management identify sales trends, evaluate product contribution and monitor business performance.
2. Category-Wise Sales and Margin Analysis
Category-level reporting helps retailers understand the revenue and margin contribution of different product groups.
This information supports better assortment planning, pricing decisions and category management.
3. Inventory Movement and Stock Analysis
LOGIC ERP supports inventory management through product-wise stock tracking, stock movement reports and inventory control capabilities.
Retailers can monitor stock levels, analyse product movement and make better replenishment decisions.
4. Batch-Wise and Expiry-Wise Inventory Management
Grocery retailers dealing with products that have expiry dates require accurate batch-level inventory visibility.
LOGIC ERP supports batch-wise stock management, expiry tracking and inventory monitoring to help retailers control ageing inventory and reduce avoidable losses.
5. Multi-Store Business Reporting
Retail chains need consolidated business visibility without losing individual outlet-level information.
LOGIC ERP helps businesses manage multiple locations and analyse their performance through store-level and consolidated reporting.
6. Business Insights and Decision Support
LOGIC ERP offers Business Insights dashboards and reporting capabilities that help management evaluate business performance and make informed decisions.
Retailers can use business reports to understand sales patterns, monitor operational performance and identify areas requiring improvement.
7. Integrated Retail Operations
By connecting billing, inventory and purchasing operations, LOGIC ERP helps maintain consistent business information across retail activities.
This reduces dependence on disconnected reports and supports better coordination between store operations and management.
With over 30 years of ERP excellence, LOGIC ERP provides retail businesses with technology to manage operations, improve business visibility and support growth across multiple locations.
Future of Grocery Retail Analytics: AI, Automation and Predictive Insights
Grocery retail analytics is evolving from traditional reporting towards predictive and AI-powered business intelligence.
Modern retailers increasingly need systems that not only explain past performance but also help anticipate future business requirements.
Some emerging applications include:
1. AI-Powered Sales Forecasting
AI-powered analytics can analyse historical sales, seasonal trends, promotional activities and other demand signals to estimate future product requirements.
This helps retailers plan inventory and purchasing more effectively.
2. Predictive Inventory Management
Predictive analytics can help identify products likely to experience stockouts, excess inventory or declining demand.
Retailers can use these insights to improve replenishment planning.
3. Automated Business Reporting
Automated reporting reduces the time spent preparing spreadsheets and consolidating information from different business operations.
Managers can receive regular performance summaries and focus on addressing business issues.
4. Intelligent Category Management
AI-based analytical tools can help retailers identify category trends, evaluate product performance and discover opportunities for assortment optimisation.
5. Customer Behaviour Insights
Advanced analytics can help retailers understand purchasing patterns, customer preferences and product combinations.
These insights can support more relevant promotions and personalised shopping experiences.
The future of grocery retail analytics will increasingly focus on combining operational data, predictive insights and automated decision support to improve business efficiency.
Conclusion
Grocery retail analytics is essential for retailers looking to improve sales performance, optimise category management and increase store profitability.
By analysing product-wise sales, category contribution, inventory movement, purchasing patterns and operating expenses, retailers can identify business opportunities and address operational inefficiencies.
However, successful analytics depends on having accurate, connected and accessible business data.
An integrated grocery retail management solution like LOGIC ERP helps retailers connect essential business operations, generate meaningful reports and gain better visibility into their performance.
Whether managing a single grocery store or a multi-location supermarket chain, data-driven decision-making can help build a more efficient, profitable and scalable retail business.
Call at +91-73411-41176/75 or send us an email at sales@logicerp.com to book a free demo today!
Frequently Asked Questions
1. What is Grocery Retail Analytics?
Grocery retail analytics is the process of collecting and analysing sales, inventory, purchasing, customer and financial data to evaluate grocery store performance. It helps retailers understand product demand, category profitability, inventory movement and business growth opportunities.
2. Why is Retail Analytics Important for Grocery Stores?
Retail analytics helps grocery stores monitor sales performance, identify profitable product categories, reduce excess inventory, improve purchasing decisions and track store profitability. It enables retailers to make informed decisions using actual business data.
3. What are the Most Important KPIs for Grocery Retailers?
Important grocery retail KPIs include total sales revenue, sales growth, average transaction value, gross profit margin, inventory turnover, sell-through rate, stockout rate, shrinkage rate, category-wise profit contribution and sales per square foot.
4. How does Category Analysis Help Grocery Retailers?
Category analysis helps retailers evaluate sales revenue, product movement and gross margins across different grocery categories. It identifies high-performing and underperforming categories, supports assortment planning and helps improve overall profitability.
5. How can Grocery Retailers Analyse Store Profitability?
Retailers can analyse store profitability by evaluating net sales, cost of goods sold, gross profit, operating expenses, inventory losses and store-wise financial performance. Comparing these metrics across different outlets helps identify profitable stores and operational gaps.
6. What is Inventory Analytics in Grocery Retail?
Inventory analytics involves analysing stock levels, product movement, inventory turnover, stock ageing, expiry dates and stock availability. It helps grocery retailers reduce excess inventory, prevent stockouts and minimise losses from expired or damaged products.
7. What is the Difference Between Sales Analytics and Retail Analytics?
Sales analytics focuses primarily on revenue, transactions, product performance and sales trends. Retail analytics covers a broader range of business operations, including sales, inventory, purchasing, customer behaviour, category performance and profitability.
8. How does Grocery Retail Analytics Improve Profitability?
Grocery retail analytics improves profitability by identifying low-margin products, controlling discounts, reducing inventory losses, improving stock turnover, optimising purchasing and monitoring operating expenses.
9. What should a Grocery Retail Analytics Dashboard Include?
A grocery retail analytics dashboard should include sales performance, product-wise sales, category-wise margins, inventory movement, purchase analysis, stock ageing, store-wise performance and profitability metrics.
10. Which Software is Best for Grocery Retail Analytics?
The right software should integrate billing, inventory management, purchasing, sales reporting and business intelligence. LOGIC ERP offers integrated grocery and supermarket management capabilities with Business Insights dashboards and reporting tools to help retailers monitor business performance.

Author
Gurbir Singh
Co-founder & Managing Director | LOGIC ERP Solutions Pvt. Ltd.
With 30+ years of experience in the tech industry, I took the helm of technology & product development, ensuring LOGIC ERP’s continuous innovation & leadership in the evolving tech landscape.

