Complete Guide
Explore a complete guide on ABC analysis in inventory management, its full form, meaning and techniques for inventory control and cost accounting.

This comprehensive guide explores ABC analysis, inventory management techniques to help organizations optimize stock control and resource allocation. Whether you are an inventory manager, supply chain professional, or business owner, this guide will provide you with practical insights into how ABC analysis works, why it matters, and how to implement it effectively.
By understanding and applying the 80/20 rule through ABC analysis, you can prioritize high-value inventory items, reduce carrying costs, and improve overall operational efficiency. The guide also demonstrates how LOGIC ERP solutions can automate and enhance your ABC classification process for even greater results.
Get ABC Inventory Management Process GuideABC analysis is an inventory management technique that categorizes inventory items into three classes: A, B, and C based on their importance to the business, allowing companies to focus resources on the most critical items.
ABC analysis is an inventory categorization technique that divides inventory items into three categories: A, B, and C based on their annual consumption value, item cost, and importance to business operations. This process is known as the classification of inventory, where items are grouped into A, B, and C categories using ABC analysis. This selective inventory control method enables organizations to prioritize inventory management efforts by allocating resources proportionate to the monetary value, item cost, and strategic significance of each item category.
10–20% of total inventory items, accounting for 70–80% of total inventory value.
20–30% of stock with 15–25% of value contribution.
50–70% of inventory items contributing only 5–10% to overall consumption value.
The benefits of ABC analysis in inventory control and management include prioritizing high-value items, improving inventory efficiency, and streamlining operations by focusing on categories that contribute most to revenue.
By completing this guide, you will gain:
The Pareto Principle, commonly known as the 80/20 rule, provides the theoretical foundation for ABC analysis in inventory management. This principle states that approximately 80% of effects come from 20% of causes, in inventory terms, roughly 80% of inventory value typically comes from just 20% of inventory items.
ABC analysis operationalizes this principle by formally categorizing SKUs according to their contribution to total inventory value. An ABC analysis diagram, such as a Pareto chart, is commonly used to visualize this distribution and highlight the concentration of value among a small subset of items. In addition to value, sales volume is another important metric often analyzed in conjunction with value to optimize inventory management and better predict inventory needs. Rather than treating all inventory items equally, this approach recognizes the disproportionate distribution of value across stock and enables efficient resource allocation accordingly.
Industry experience shows that actual distributions vary from the theoretical 80/20 split. Manufacturing operations with numerous component parts often see more extreme skew, where 10% of items may represent 80% of value. Retail environments with many low-cost SKUs frequently show higher percentages in Category C. Healthcare and pharmaceutical sectors dealing with critical items and perishables present unique patterns that require threshold adjustments.
These variations underscore why organizations must establish thresholds based on their specific supply chain management context rather than applying rigid percentages universally.
| Industry | Category A (Items/Value) | Category B (Items/Value) | Category C (Items/Value) |
|---|---|---|---|
| Manufacturing | 10% / 75% | 20% / 15% | 70% / 10% |
| Retail | 15% / 70% | 25% / 20% | 60% / 10% |
| Healthcare | 20% / 65% | 30% / 25% | 50% / 10% |
ABC inventory analysis can be easily calculated in a stepwise process. Let's explore all steps involved in ABC inventory analysis.
The ABC analysis formula centers on calculating annual consumption value for each inventory item, then ranking and categorizing based on cumulative contribution to total inventory value.
Gather annual usage quantities and unit costs for all inventory items — item cost is a crucial data point for accurate ABC classification. Data sources include your ERP system, purchasing records, and inventory management systems. Ensure data is current, accurate, and cleaned of obsolete SKUs.
Apply the core formula:
Sort all inventory items in descending order by annual consumption value. The items consuming the most resources appear at the top.
Compute cumulative annual consumption value and cumulative item count. Convert both figures into percentages of totals to identify where value concentrates.
Establish percentage boundaries for ABC classes:
Classify each item based on where its cumulative value percentage crosses threshold boundaries.
Demand patterns shift, costs fluctuate, and customer demand evolves. Schedule regular reviews — quarterly or semi-annually — to maintain up-to-date data and accurate classifications.
Explore ABC Analysis in Cost AccountingThis example illustrates how ABC analysis supports the classification of inventory control, helping organizations determine the appropriate level of oversight for each category. The accompanying image below is an ABC analysis graph, which visually represents the distribution of inventory value across categories A, B, and C, making it easier to identify which items contribute most to the total inventory value.
Consider a distributor with 12 inventory items. The following table demonstrates complete ABC classification:
| Item | Annual Qty | Unit Cost (₹) | Annual Value (₹) | % of Total | Cumulative % | Category |
|---|---|---|---|---|---|---|
| Item 1 | 1,000 | ₹4,100 | ₹4,100,000 | 25.0% | 25.0% | A |
| Item 2 | 500 | ₹6,560 | ₹3,280,000 | 20.0% | 45.0% | A |
| Item 3 | 600 | ₹4,100 | ₹2,460,000 | 15.0% | 60.0% | A |
| Item 4 | 400 | ₹3,280 | ₹1,312,000 | 8.0% | 68.0% | A |
| Item 5 | 800 | ₹1,230 | ₹984,000 | 6.0% | 74.0% | A |
| Item 6 | 1,500 | ₹492 | ₹738,000 | 4.5% | 78.5% | B |
| Item 7 | 2,000 | ₹328 | ₹656,000 | 4.0% | 82.5% | B |
| Item 8 | 700 | ₹820 | ₹574,000 | 3.5% | 86.0% | B |
| Item 9 | 3,000 | ₹164 | ₹492,000 | 3.0% | 89.0% | B |
| Item 10 | 5,000 | ₹82 | ₹410,000 | 2.5% | 91.5% | B |
| Item 11 | 4,000 | ₹164 | ₹656,000 | 4.0% | 95.5% | C |
| Item 12 | 9,000 | ₹82 | ₹738,000 | 4.5% | 100.0% | C |
| Total Annual Value | ₹16,610,000 | |||||
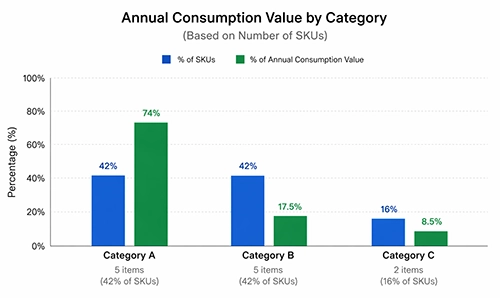
This analysis reveals that focusing management efforts on just five items controls nearly three-quarters of inventory value. Category A items warrant tight control, frequent ordering review, and premium supplier relationships. Category C items require minimal oversight, allowing bulk ordering and simplified reorder policies.
Explore ABC Inventory Management GuideLet's understand "how ABC analysis is useful in inventory management?" in detail. ABC analysis transforms inventory control from overwhelming complexity into manageable prioritization. The ABC system in inventory management provides a structured approach to categorizing and controlling stock based on value and importance. By classifying inventory into three categories, managers focus where attention creates maximum impact.
Category A items demand rigorous monitoring because small percentage improvements yield substantial cost savings. Managers concentrate analytical effort on these critical items rather than distributing attention equally across all stock levels. By focusing on the most critical inventory items, organizations can prioritize and allocate resources to ensure these high-value products are always available and properly maintained.
Ordering cadence aligns with category importance. Category A items receive frequent review cycles and carefully negotiated supplier contracts. C category items use simplified automated reordering, reducing administrative burden while maintaining adequate stock levels.
Without ABC classification, managers often spend disproportionate time on low value items that contribute minimally to business outcomes. ABC analysis redirects this effort toward prioritizing high value items that drive operational efficiency and gross profit margin.
When supply chain disruptions occur or budget constraints emerge, ABC classification provides immediate guidance. Protect Category A availability first, then B, then C. This framework accelerates decision-making during uncertainty.
The benefits of ABC analysis in inventory management include prioritizing high-value items, improving inventory efficiency, and streamlining operations by focusing on categories that contribute most to revenue. By reducing excess inventory in Category C while maintaining optimal stock levels for Category A, organizations free significant cash previously tied in unproductive inventory. This better resource allocation improves financial flexibility.
Storage, insurance, handling, and obsolescence costs decrease when organizations right-size inventory investment per category. Category C items held in appropriate quantities reduce holding costs substantially.
Tighter control of Category A items prevents both stockouts and excess stock. Faster-moving high value inventory generates better return on investment and improved customer satisfaction.
Concentrated purchasing volume for Category A items creates negotiation leverage, enabling better pricing, priority during shortages, and quality commitments.
Staff training, warehouse organization, and inventory management processes all benefit from clear categorization. Resources flow to where they matter most.
Successful ABC analysis implementation requires systematic methodology and organizational commitment.
Establish what "value" means for your organization: consumption cost, revenue contribution, or profitability. Align classification criteria with business strategy.
Before calculating, audit inventory records for accuracy. Remove discontinued items, correct unit costs, and verify annual usage figures. Poor data produces poor categories.
Apply the ABC analysis formula consistently across all inventory items. Use spreadsheet tools or ERP system capabilities to manage calculations at scale.
Standard 70-80/15-25/5-10 splits serve as starting points. Adjust based on industry norms, risk tolerance, and strategic priorities.
Purchasing, operations, finance, and sales all interact with inventory. Their input ensures classification reflects operational reality, not just financial metrics.
Augment value-based classification with criticality scores, lead time risk, and demand variability. This addresses limitations of pure monetary analysis.
Define distinct safety stock levels, reorder points, supplier requirements, and review frequencies for each category. Document these policies clearly.
Quarterly reassessment identifies items shifting between categories due to changing demand patterns or cost fluctuations. Maintain current classifications for effective control. Using technology for managing inventory streamlines the implementation of ABC analysis best practices and simplifies the process from end-to-end.
Cycle counting replaces disruptive annual physical inventories with ongoing verification processes. ABC classification optimizes cycle counting by aligning count frequency with item importance.
Regularly conducting cycle counts based on ABC classification ensures that high-value items (Class A) are checked more frequently than lower-value items (Class B and C).
| Category | Recommended Count Frequency | Rationale |
|---|---|---|
| A | Monthly or more frequently | High value justifies verification investment |
| B | Quarterly | Moderate value, moderate attention |
| C | Annually or semi-annually | Low value items need minimal count resources |
Rather than counting all items equally, organizations concentrate counting effort on Category A items where accuracy matters most. A 1% error in Category A inventory records costs far more than equivalent error rates in Category C.
Modern ERP systems generate cycle counting schedules automatically based on ABC classification. Staff receive daily or weekly count assignments weighted toward high-value items. Discrepancies trigger investigation procedures appropriate to category.
Category A discrepancies warrant immediate root cause analysis — potential theft, process failures, or receiving errors require urgent attention. Category C discrepancies may accumulate for batch investigation, conserving management effort.
Moving from concept to operational practice requires structured implementation.
Evaluate current inventory management processes, data quality, and staff capabilities. Identify gaps requiring attention before classification begins. Assess whether existing inventory management systems support ABC functionality.
Determine how ABC classifications will integrate with purchasing, warehousing, and financial systems. LOGIC ERP and similar platforms offer native ABC support; legacy systems may require custom development or manual processes.
Train inventory management personnel on ABC principles, classification methodology, and category-specific procedures. Document policies clearly so consistent practices persist through staff transitions.
Begin with a subset of inventory: perhaps one product line or warehouse location. Validate that calculations produce sensible classifications and that operational procedures function before full rollout.
Define KPIs to track ABC analysis implementation impact:
Raw materials and components classification enables focused supplier management for critical items. Category A components receive quality audits, backup sourcing strategies, and tight delivery monitoring. Misclassifying a critical component can halt production lines.
Product mix optimization uses ABC classification to allocate shelf space, promotional budgets, and replenishment attention. Category A products occupy prime locations. Category C items may transition to clearance or drop-ship fulfillment.
Medical supplies and pharmaceuticals present unique challenges where low-cost items may be life-critical. Healthcare organizations typically augment standard ABC analysis with criticality weighting to ensure emergency medications receive appropriate attention.
Parts management for service operations involves thousands of SKUs. ABC classification guides stocking decisions — Category A fast-movers remain on-site while Category C slow-moving parts may route through regional distribution or special-order processes.
Perishable goods add expiry considerations to ABC analysis. High-value Category A ingredients require careful demand forecasting. Category C items with long shelf life tolerate bulk ordering strategies.
Category A items receive faster picking, priority warehousing locations, & same-day or next-day delivery focus. Category B items are managed with balanced stock levels, and Category C products may be stored in secondary warehouses.
Italian economist Vilfredo Pareto observed around 1906 that approximately 80% of Italian land was owned by 20% of the population. This observation of disproportionate distribution — later formalized as the Pareto Principle — provided a conceptual foundation for many business applications.
H. Ford Dickie of General Electric formally applied Pareto's principle to inventory management in 1951, publishing "ABC Inventory Analysis Shoots for Dollars, not Pennies." Dickie advocated focusing management attention on high-value items rather than treating all inventory equally.
Through the 1960s and 1970s, ABC analysis became standard practice in material planning and manufacturing operations. The methodology transitioned from manual spreadsheet calculations to embedded ERP functionality beginning in the 1980s, enabling real-time classification and automated policy application.
Today's inventory management techniques incorporate ABC analysis as foundational capability. Advanced applications combine ABC with XYZ analysis (demand variability), machine learning for predictive classification, and multi-criteria decision frameworks that consider criticality, lead time, and supply risk alongside consumption value.
LOGIC ERP transforms ABC analysis from periodic manual exercise into continuous, automated inventory optimization.
LOGIC ERP calculates annual consumption value automatically from transaction data, applying configurable thresholds that reflect your specific business context. Adjust category boundaries and generate classifications without manual spreadsheet manipulation.
As consumption patterns shift, LOGIC ERP identifies items moving between ABC classes. Dashboard alerts notify managers when Category B items trend toward A status or when formerly critical items decline — enabling proactive policy adjustments.
ABC classification connects directly to LOGIC ERP's forecasting capabilities. Category A items receive sophisticated demand modeling; simpler approaches suffice for predictable Category C items, supporting efficient managing inventory through automated forecasting.
Visual dashboards highlight Category A performance metrics: stockout incidents, days of supply, supplier delivery performance, and carrying costs. Managers access the information needed without manual report generation.
LOGIC ERP generates cycle counting schedules aligned with ABC classification. Staff receive assignments weighted toward high-value items, count results update inventory records automatically, and discrepancies route to appropriate investigation workflows.
Organizations implementing LOGIC ERP's ABC capabilities report significant inventory efficiency gains, reduced excess inventory, improved turnover rates, and decreased carrying costs. Automation eliminates manual effort while ensuring classifications remain current and actionable.


ABC analysis provides a proven framework for optimizing inventory levels and allocating resources where they generate maximum return. By classifying inventory items into three categories based on annual consumption value, organizations focus management efforts on the 20% of items representing 80% of value while applying appropriate lightweight controls to remaining stock. ABC analysis can also be used alongside other inventory management techniques to further optimize stock control and decision-making.
Ready to transform your inventory management with automated ABC analysis? Contact LOGIC ERP experts for a consultation on how our platform optimizes inventory control for your specific business requirements.
Book a Free DemoABC analysis is an inventory management technique used to classify items into three categories: A, B, and C, based on their value and importance, helping businesses prioritize high-value items, control costs, and improve overall inventory efficiency.
Category A typically includes 10-20% of inventory items representing 70-80% of total inventory value. However, optimal percentages vary by industry, manufacturing may see 10% of items driving 80% of value, while retail distributions often show broader Category A populations.
Review ABC classifications quarterly for most businesses, or semi-annually at minimum. Organizations with high product turnover, seasonal demand patterns, or volatile pricing should consider monthly reviews to maintain accurate classification.
Yes. Service businesses apply ABC principles to classify customers by revenue contribution, projects by profitability, or suppliers by spend volume. The methodology extends beyond physical inventory to any resource allocation decision involving disproportionate value distribution.
ABC analysis classifies items by value (consumption cost); XYZ analysis classifies by demand variability (predictability). Combining both creates a matrix, AX items (high value, stable demand) differ strategically from CZ items (low value, unpredictable demand). Together they enable more sophisticated inventory management techniques. These are just two of several other inventory management techniques available to businesses, each offering unique approaches to inventory classification and control.
Just-in-time systems benefit from ABC classification by identifying which items warrant JIT treatment. Category A items with stable demand often suit JIT approaches, minimizing inventory investment. Category C items may use bulk ordering regardless of JIT principles.
Essential data includes annual usage quantity and unit cost for each SKU. Enhanced analysis incorporates lead times, demand variability, supplier reliability, and item criticality. Accurate inventory records form the foundation, poor data quality undermines classification validity.
LOGIC ERP automatically calculates annual consumption value from transaction history, applies configurable classification thresholds, alerts managers to category shifts, integrates classifications with forecasting and procurement, and generates cycle counting schedules, eliminating manual analysis while maintaining current, actionable categories.
ABC analysis is an inventory management technique that categorizes items into three groups (A, B, and C) based on their value and importance, helping businesses prioritize control and optimize stock management.
The full form of ABC analysis is Always Better Control, which reflects its purpose of improving inventory efficiency and control.
ABC analysis is a technique developed for classifying inventory based on value and usage, enabling better decision-making and resource allocation.
ABC analysis technique is used for inventory control, cost management, and prioritizing high-value items in businesses such as retail, manufacturing, and warehouses.
In cost accounting, ABC analysis helps categorize materials based on their cost significance, allowing companies to focus more on high-cost items (A category) for better financial control.
ABC analysis in material management is used to optimize procurement, storage, and usage of materials by focusing on critical inventory items.
ABC inventory control focuses on tighter control of high-value items and relaxed control of low-value ones.
Advantages include better control, reduced costs, improved focus, and efficient resource allocation.
It is a method of managing inventory based on value prioritization.
ABC analysis is based on annual consumption value, which is calculated as: Quantity consumed × Cost per unit
ABC classification groups inventory into A, B, and C categories based on their importance and contribution to total inventory value.
ABC inventory management is a method of managing stock by prioritizing items based on their value and importance to the business.
ABC inventory control helps businesses maintain optimal stock levels by focusing more control on high-value items and less on low-value ones.
The ABC system is a structured approach that categorizes inventory into three classes to simplify stock monitoring and decision-making.
ABC warehouse management organizes storage and picking processes by placing high-value or fast-moving items in easily accessible locations.
Classification of inventory refers to grouping stock based on criteria such as value, usage, or importance, ABC analysis being one of the most common methods.
It is the process of categorizing inventory management techniques (like ABC, VED, FSN) to improve efficiency and control.
An ABC analysis diagram typically represents inventory distribution using a Pareto chart, showing how a small percentage of items contributes to a large portion of value.
An ABC analysis numerical example involves calculating annual consumption value for items and ranking them into A, B, and C categories based on their contribution.
C category items typically represent: ~70–80% of total items But only ~5–10% of total inventory value
In restaurant inventory management, ABC analysis helps track high-cost ingredients (like meat or dairy) more closely while simplifying control for low-cost items.
The ABC technique focuses on prioritizing inventory based on value, ensuring tight control over critical items and relaxed control over less important ones.
The ABC method is a strategic approach to inventory optimization using classification and prioritization for better efficiency.
It refers to the benefits of using ABC analysis, such as cost savings, improved stock visibility, and better operational efficiency.
In Just-In-Time (JIT), inventory is kept at a minimum level to reduce holding costs and improve efficiency.
ABC analysis improves customer satisfaction by ensuring that high-priority inventory items (Category A) are always in stock, reducing stockouts and delays. By focusing on key products that drive revenue and demand, businesses can fulfill orders promptly and maintain reliable supply chain performance, enhancing the overall customer experience.
ABC analysis categorizes inventory items based on their consumption value and importance, allowing businesses to allocate attention and resources efficiently. This targeted approach to inventory management techniques helps control inventory levels, reduce carrying costs, and optimize stock replenishment for different item categories.
Compared to other inventory management techniques, ABC analysis focuses on prioritizing inventory based on economic value, enabling efficient resource allocation. It complements methods like safety stock management and demand pattern analysis by providing a clear framework to identify critical items, streamline supply chain operations, and reduce excess inventory.
ABC analysis enables efficient resource allocation by directing management efforts, budget, and time toward high-value inventory items that significantly impact business performance. This prioritization ensures that safety stock levels and reorder frequencies are tailored to each category, improving inventory control and reducing waste.
Yes, ABC analysis should be regularly reviewed and updated to reflect evolving demand patterns and market conditions. Integrating ABC classification with real-time supply chain data and forecasting tools allows businesses to respond dynamically to fluctuations, maintain optimal inventory levels, and improve overall supply chain resilience.
ABC analysis helps safely stock inventory by categorizing items based on their value and importance, ensuring that high-value Category A items receive closer monitoring and appropriate safety stock levels. This prioritization reduces the risk of stockouts for critical items, maintaining smooth operations and customer satisfaction.
Efficient resource allocation in ABC inventory management directs time, budget, and effort toward managing high-value items (Category A) more intensively while applying simpler controls to lower-value items (Categories B and C). This targeted approach optimizes inventory control, reduces carrying costs, and improves overall operational efficiency.
Restaurant inventory management involves tracking and controlling food and beverage stock to minimize waste, reduce costs, and ensure ingredients are available to meet customer demand efficiently.
There are five classes of IP addresses: Class A, B, C, D, and E, each serving different purposes in network design and allocation.
The percentage of total inventory for c category material is about 70-80% of total inventory items but only contribute around 5-10% of the total inventory value.
The ABC method is an inventory management technique that categorizes items into three classes, A, B, and C, based on their importance and value to prioritize control and resource allocation.
ABC analysis is a technique that classifies inventory items into categories A, B, and C based on their annual consumption value, helping businesses focus on managing high-value items effectively.
ABC inventory management is the practice of organizing and controlling stock by categorizing items according to their value and criticality, allowing for optimized inventory control and resource allocation.
ABC analysis in inventory control is a technique used to categorize inventory items into three groups: A (high value), B (moderate value), and C (low value), based on their importance, helping businesses prioritize stock management, reduce costs, and improve overall inventory efficiency.
The basis of ABC analysis in inventory control is the annual consumption value of items, calculated as (quantity consumed × cost per unit), which helps identify high-value items that require tighter control and monitoring.
ABC analysis classifies inventory items into three categories: A, B, and C, based on their annual consumption value and importance to the business. Category A items are the most valuable, typically representing 10-20% of total inventory but accounting for 70-80% of inventory value. Category B items have moderate value and make up 20-30% of inventory with 15-25% of value. Category C items are low-value, often comprising 50-70% of inventory while contributing only 5-10% of the total value. This classification method helps prioritize inventory control and resource allocation effectively.
To do ABC analysis in Excel, start by listing all inventory items with their annual usage quantities and unit costs. Calculate the annual consumption value by multiplying quantity by cost for each item. Sort items in descending order by consumption value. Then calculate the cumulative consumption value and cumulative percentage of total value. Assign items to categories A, B, or C based on cumulative percentage thresholds (typically 70-80% for A, next 15-25% for B, and remaining 5-10% for C). Excel formulas and charts can help automate and visualize this process.
An ABC analysis graph is typically a Pareto chart that displays inventory items ranked by annual consumption value alongside their cumulative percentage contribution. To draw it, order items by descending consumption value, calculate cumulative percentages, and plot a bar chart for individual item values with a line graph for cumulative percentages on a secondary axis. This visualization highlights the 80/20 distribution, helping identify high-priority inventory.
Making ABC analysis involves collecting inventory data including item quantities and unit costs, calculating annual consumption values, sorting items by value, and classifying them into A, B, and C categories based on cumulative percentage thresholds. This method prioritizes inventory management efforts on high-value items to optimize stock control, reduce carrying costs, and improve operational efficiency.
In Excel, after calculating annual consumption values and cumulative percentages, select the data and insert a combination chart with bars for individual item values and a line for cumulative percentage. Use a secondary axis for the cumulative percentage line to create a clear Pareto chart. This graph visually represents the ABC classification and supports data-driven inventory decisions.
Calculate cumulative percentage by summing the annual consumption values of items in descending order and dividing by the total consumption value, then multiplying by 100. This cumulative percentage determines the thresholds for categorizing items into A, B, and C classes in ABC analysis.
To perform ABC analysis of inventory in Excel, list each item with its annual usage and unit cost, compute annual consumption value, sort items by descending value, calculate cumulative consumption and cumulative percentage, and assign ABC categories based on set thresholds. Utilize Excel functions like SUM, SORT, and charts to automate and visualize the analysis.
ABC analysis is used in inventory management to prioritize stock control by categorizing items into A, B, and C classes based on their value and consumption. This enables businesses to focus more resources and tighter controls on high-value Category A items, moderate attention on B items, and simpler management for low-value Category C items, optimizing inventory levels and reducing carrying costs.
In financial management, ABC analysis categorizes expenses, assets, or inventory based on their financial impact or consumption value. This helps organizations prioritize budgeting and cost control efforts on high-impact items, improving financial efficiency and resource allocation aligned with business goals.
ABC analysis in operations management classifies inventory or activities by their importance or cost contribution, enabling operations teams to focus resources on critical components or processes. This improves operational efficiency, reduces waste, and enhances productivity by prioritizing key areas.
ABC analysis of inventory control segments inventory items into A, B, and C categories based on consumption value and importance. This classification guides inventory policies, with strict control and frequent review for Category A items, moderate control for B, and minimal oversight for C, leading to improved stock management and cost savings.
ABC analysis of material control categorizes materials by their annual consumption value to optimize procurement, storage, and handling. High-value materials (Category A) receive close monitoring and control, while low-value materials (Category C) are managed with simpler procedures, enhancing overall material management efficiency.
ABC analysis is an inventory management method that classifies items into three categories, A, B, and C based on their annual consumption value and importance to the business. This approach helps prioritize inventory control and resource allocation efficiently. The advantages of ABC analysis include reduced carrying costs, improved inventory turnover, optimized stock levels, enhanced supplier negotiations, and streamlined operations. By focusing on high-value Category A items, businesses can prevent stockouts and minimize excess inventory, boosting overall profitability and operational efficiency.
An example of ABC analysis is a retail store categorizing its products based on annual sales value. High-value electronics like laptops may be classified as Category A items, representing about 20% of the inventory but contributing 80% of sales revenue. Mid-range appliances such as blenders might fall into Category B, while low-cost accessories like phone cases are Category C. This classification helps the store focus inventory management efforts on critical items, ensuring optimal stock levels and reducing carrying costs.
In inventory management, ABC analysis segments stock into three classes based on annual consumption value. For example, a manufacturing company might classify expensive machine parts as Category A due to their high cost and criticality, moderate-value components as Category B, and inexpensive fasteners as Category C. This classification allows inventory managers to prioritize monitoring and replenishment frequency, improving inventory accuracy and reducing holding costs.
ABC analysis divides inventory into A, B, and C categories according to each item's contribution to overall inventory value. For instance, if a company sells 100 products, 20 of them (Category A) might account for 80% of the total inventory value, 30 products (Category B) for 15%, and 50 products (Category C) for 5%. This method helps allocate management attention and resources effectively, focusing on the most impactful items.
ABC analysis is important because it enables businesses to optimize inventory management by focusing on the most valuable items that significantly impact financial performance. It reduces carrying costs, prevents stockouts of critical products, improves cash flow, and enhances supplier relationships. By applying the ABC analysis method, companies can make data-driven decisions that increase efficiency and profitability.
To calculate ABC inventory analysis, multiply the annual quantity used of each item by its unit cost to find the annual consumption value. Then, rank items from highest to lowest based on this value. Calculate the cumulative percentage of total consumption value and classify items into categories: A (top 70-80%), B (next 15-25%), and C (remaining 5-10%). This calculation helps prioritize inventory management efforts according to item importance.
To calculate the cumulative percentage of items in ABC analysis, first list all inventory items sorted by descending annual consumption value. Then, calculate the percentage each item contributes to the total consumption value. Next, add these percentages sequentially to get the cumulative percentage. This cumulative figure determines the cutoff points for categories A, B, and C, guiding classification.
Cumulative usage percentage is calculated by summing the annual consumption values of inventory items in descending order and dividing the running total by the overall total consumption value. Multiply the result by 100 to express it as a percentage. This metric helps identify the proportion of total usage accounted for by the top inventory items, essential for ABC classification.
The percentage of items in ABC analysis is calculated by dividing the number of items in each category (A, B, or C) by the total number of inventory items, then multiplying by 100. This calculation helps businesses understand the distribution of inventory items across categories, informing inventory control policies and resource allocation.
In ABC analysis A items are high-value and low-quantity items that require strict control and close monitoring, and ABC analysis is associated with inventory control and cost management techniques; in ABC analysis method what does A represent is the most important and costly category of inventory, while in ABC analysis C items refers to low-value and high-quantity items that require minimal control.
Popular Products