Explore essential database performance management features including real-time monitoring, query analysis, resource tracking, alerting, automation, and optimization to maintain optimal database performance and ensure business continuity.
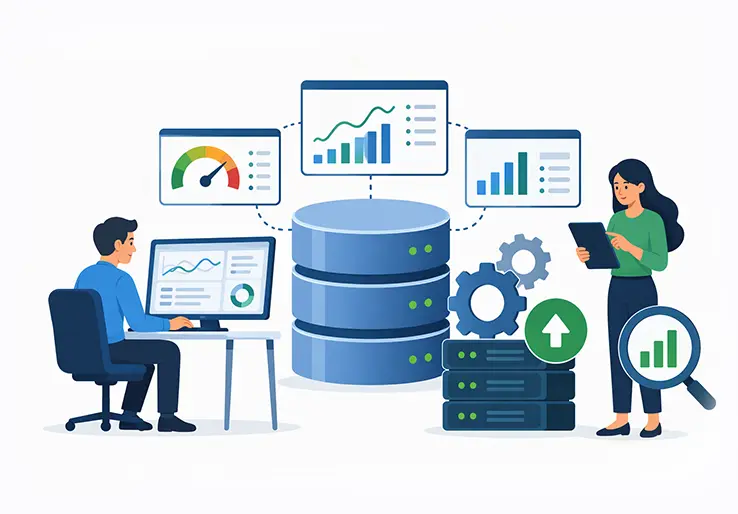
Database performance management features include real-time performance monitoring, query performance analysis, resource utilization tracking, intelligent alerting, automation, and optimization tools that help teams monitor, analyze, and improve how a database handles workloads. Database performance management is the ongoing process of monitoring, analyzing, and optimizing database workload behavior so performance issues can be identified, fixed, and verified instead of merely observed on a dashboard.
Basic database monitoring tells you something is wrong. Database performance management tells you why it is wrong, what to do about it, and whether the fix worked. For database administrators, ERP implementation teams, IT operations professionals, and business stakeholders responsible for platforms like LOGIC ERP, that difference shapes whether the team reacts to outages or prevents them.
This guide focuses on the core features that matter in day-to-day operations: real-time monitoring, availability and health checks, key performance metrics, query analysis, resource utilization tracking, bottleneck detection, alerting, automation, security monitoring, reporting, software selection, and best practices for continuous improvement. In ERP environments, database performance directly affects how fast invoices post, how quickly reports generate during GST filing periods, and whether month-end financial closes finish on schedule, making high availability, low latency, and efficient resource use essential for business-critical applications.
Database performance management is the practice of measuring key performance metrics, identifying performance bottlenecks, and applying tuning techniques on an ongoing basis. Database performance refers to how well a database management system handles queries, transactions, and concurrent user sessions under production conditions.
This practice applies to SQL databases (Microsoft SQL Server, MySQL, PostgreSQL, Oracle) and NoSQL systems (MongoDB, Cassandra) used under ERP, CRM, e-commerce, and analytics workloads. It ties together performance monitoring, capacity planning, query optimization, and incident response into a single lifecycle.
Consider a retail ERP running daily billing on SQL Server. During a festival sale, the system processes 10x the normal order volume. How does database performance hold up? Without structured performance management, database administrators discover problems only when cashiers report frozen screens. With it, the team sees rising lock wait times and CPU usage 20 minutes before checkout queues stall, and acts before customers walk away.
Database monitoring focuses on observing and alerting. Database performance management encompasses monitoring plus root-cause analysis, optimization actions, trend analysis, capacity planning, and governance policies that keep database operations healthy over time.
Here is how the two compare:
A practical scenario illustrates the gap. Monitoring detects that a query now takes 30 seconds. Performance management traces that slow query execution to a missing index on the OrderDate column, applies the index, and validates that execution time drops to 200 milliseconds. The next step is documenting the change so similar regressions are caught earlier.
LOGIC ERP customers typically start with ad-hoc monitoring during initial deployment. As database sizes grow, transaction volumes increase, and SLA requirements tighten, they shift to structured performance management. Organizations that explore the advantages of ERP systems recognize this transition as a natural part of scaling.
The following feature groups form the foundation of effective database monitoring and performance management. Each later section explains one group in depth.
Sub-minute visibility matters when thousands of transactions flow through a database every second. During month-end financial closing or a Diwali sales event, even a 30-second latency spike can block invoice processing or cause checkout failures. Database monitoring tools provide real-time visibility into system performance so teams can act within minutes, not hours.
Typical dashboards display:
Monitoring tools track query execution times and resource utilization continuously. When a query that normally completes in 50 milliseconds suddenly takes 5 seconds, the monitoring system flags it. Continuous tracking of slow query execution and latency spikes helps teams act before users feel performance degradation.
Real-time database performance monitoring also integrates with infrastructure monitoring. Correlating database metrics with CPU, memory, storage, and network data reveals whether the root cause sits in the query layer, the storage tier, or the cloud platform itself.
Availability monitoring tracks whether databases, instances, and clusters are online, responsive, and meeting SLA targets. Enterprise database environments commonly target 99.9% uptime or higher, which translates to fewer than 8.76 hours of unplanned downtime per year.
Features in this category include:
Health scores combine multiple database performance metrics (uptime percentage, error rate, average wait times) into an at-a-glance indicator. IT and business stakeholders see red, yellow, or green status without parsing raw numbers. ePak International, after migrating from SQL Server 2016 to a 3-node Always On cluster on SQL Server 2019, achieved zero downtime during the migration and reduced a sales report from 13-21 minutes to seconds.
Tracking the right key database performance metrics separates teams that react from teams that prevent. Below is a reference table covering critical metrics, what each indicates, and general threshold guidance.
| Metric | What it Indicates | Threshold Guidance |
|---|---|---|
| Query execution time | How long SQL queries take to return results | 95th percentile above 2-3 seconds warrants investigation in ERP forms |
| Throughput (TPS) | Transactions processed per second; capacity and load indicator | Drops below baseline during peak hours signal contention |
| CPU utilization | Processing demand from queries and background tasks | Sustained above 80% indicates inefficient queries or scaling need |
| Memory utilization | Buffer/cache pressure; low memory forces disk reads | Buffer cache hit ratio below 90% suggests memory pressure |
| Disk I/O latency | Read/write speed at the storage layer | Read latency above 20 ms typically causes visible slowness |
| Connection count | Active sessions hitting the database | Spikes beyond pool limits indicate connection leaks or surges |
| Lock wait times | Time transactions spend waiting for locks held by others | Rising wait times correlate with concurrency problems |
| Deadlocks | Two or more transactions permanently blocking each other | Any sustained increase needs immediate query redesign |
| Cache hit ratio | How often requested data is already in memory | Below 95% in OLTP systems means excessive disk I/O |
| Error rates | Failed queries, timeouts, connection refusals | Any upward trend demands root-cause investigation |
Slow queries identify problematic queries causing poor performance. Index hit ratio tracks how effectively indexes are used. Resource consumption analyzes CPU usage, disk space, and memory allocation across database instances.
High CPU utilization causes long loading times, and disk I/O bottlenecks lead to sluggish response times. Insufficient indexing results in slow data retrieval. A common pattern: high CPU utilization plus rising response times during peak hours usually indicates poorly optimized queries or missing indexes, requiring immediate performance analysis.
Query execution is usually the biggest contributor to overall database performance in transactional ERP workloads. Every invoice posted, every inventory lookup, and every financial report runs SQL against the database. Slow query execution delays application responsiveness across the entire system.
SQL performance monitoring features in advanced monitoring tools include:
Optimizing SQL queries improves database performance by targeting the queries that consume the most resources. Using appropriate indexes reduces slow query execution times, sometimes by orders of magnitude. Analyzing query execution plans helps identify inefficient queries that scan millions of rows instead of seeking indexed values. Comprehensive query analysis is a critical feature in database performance management tools because it connects technical root causes to business-visible symptoms.
In a documented case at a leading automotive manufacturer, optimizing MS SQL queries and schema logic improved data retrieval failure rates from 24% to 1%, dropped response times from 8 seconds to 0.2 seconds, and reduced deadlock incidents by 80%.
Performance management platforms help database administrators and developers collaborate by tracing from an application request (for example, an invoice posting in LOGIC ERP) to the underlying SQL statement and its execution plan. This end-to-end tracing turns abstract "the system is slow" complaints into specific, fixable query problems.
Resource utilization covers CPU, memory, disk I/O, and network bandwidth. Each of these directly affects database performance. Efficient memory allocation ensures smooth database operations by keeping frequently accessed data in buffer caches rather than forcing repeated disk reads.
Capacity planning features collect and store long-term utilization trends. A DBA monitoring a production database can forecast when storage will hit 80% capacity, when peak-hour CPU will exceed safe thresholds, or when tempdb growth on SQL Server will require intervention. Historical data allows analysis of performance trends and enables capacity planning months ahead of a crisis.
ML- or rules-based forecasting capabilities predict resource exhaustion before it impacts production. For example, a monitoring system might project that at current growth rates, the transaction log volume will fill available storage within 45 days, giving the team time to provision additional space or implement archiving.
Real-time resource tracking is essential for database performance management tools, especially in ERP environments where workloads shift between OLTP during the day and heavy reporting overnight. LOGIC ERP implementers and database administrators use these insights to plan hardware upgrades, cloud scaling (vertical or horizontal), and archive policies aligned with business cycles.
Common performance bottlenecks in database systems include slow query execution from full table scans, locking and contention between concurrent transactions, misconfigured or missing indexes, saturated CPU or disk I/O, and network latency between application and database servers. Locking and concurrency problems hinder overall system throughput, especially during high-volume periods like financial closing.
Performance management features for automatic bottleneck detection correlate spikes in response time with underlying wait events. If response times jump at 11:00 AM every day, the system might trace it to a reporting query scanning millions of rows without an index, competing with transactional workloads for the same data.
Deadlock detection captures real-time conflicts between transactions, surfacing cases where two or more processes permanently block each other. Database monitoring tools help reduce crashes and bottlenecks by identifying these patterns before they cascade into application-level failures.
Drill-down views connect symptoms to root causes. A user reports that the inventory screen loads in 15 seconds instead of 2. The DBA drills from the latency spike to the specific SQL statement, finds a missing index on the WarehouseID column, adds it, and validates that load time returns to under 2 seconds. At Altenloh, Brinck & Co., order shipping was delayed by a full day due to slow SQL waits; after performance improvements, application performance improved by more than 50% without additional hardware.
Configurable alerting features trigger notifications based on thresholds (CPU above 80%), baseline deviations (response time 3x above normal), and anomalies in database performance metrics like replication lag or sudden error rate spikes. Automated alerts in monitoring tools help identify performance issues before they affect business operations.
Multi-channel notifications reduce mean time to resolution:
A good database performance management tool minimizes alert fatigue for IT operations. Firing 200 alerts per day for minor metric fluctuations trains teams to ignore notifications. Customizable alert rules can improve operational response to performance issues by focusing on alerts that correlate with business impact, such as billing queries exceeding SLA thresholds or replication lag threatening data consistency.
Automated alerting is an important feature of database performance management tools. The best monitoring solutions combine multi-metric correlation (latency + error rate + CPU) to reduce noise and surface only alerts that require action.
Automation moves database performance management beyond reactive firefighting. Scheduled index maintenance, statistics refreshes, and automated connection pool resets remove repetitive manual tasks from the DBA’s workload. Regular index maintenance prevents index degradation over time, keeping query plans efficient as data volumes grow.
Recommendations engines (sometimes called "tuning advisors") analyze slow query execution, missing indexes, and unused indexes, then propose concrete changes. Oracle’s SQL Tuning Advisor, for example, recommends improvements where expected benefit is 2x or more in execution time. A typical recommendation might be: "Add composite index on Invoice Date + Customer ID to reduce scan time on the OrderHistory table by 85%."
Caching frequently accessed data minimizes database load and improves response times. Optimizing SQL queries can reduce CPU consumption by 40-60% in systems where a small number of queries dominate resource usage.
Self-healing actions that can be safely automated include:
For financial or compliance-sensitive environments like LOGIC ERP, performance management teams should retain human approval for high-risk actions such as schema changes or index drops. LOGIC ERP 2.0’s AI-powered capabilities demonstrate this balance between automation and governance.
Security controls like encryption at rest and in transit, row-level security, and audit trails affect database performance. Encryption adds CPU overhead to every read and write. Audit logging increases disk I/O and storage consumption. Database performance management features must account for both optimal performance and security threats simultaneously.
Database activity monitoring tools track login failures, unusual query patterns, privilege escalations, and massive data exports that may indicate breaches or misuse. If sudden spikes in resource utilization coincide with large SELECT scans against sensitive tables from an unfamiliar user identity, the system flags the activity for investigation.
Integrating database logs and audit trails with SIEM platforms gives security teams visibility into both threat patterns and their performance cost. The database monitoring system tracks how much CPU, I/O, and storage the logging infrastructure itself consumes, preventing a scenario where security monitoring degrades the database availability it is supposed to protect.
Historical reporting and dashboards support database performance analysis beyond day-to-day firefighting. Historical performance tracking helps troubleshoot intermittent issues that do not appear in real-time views, such as a query that degrades only on the first business day of each month.
Common analytics views include:
IT leaders and product owners use these dashboards to justify infrastructure investments. When a business intelligence platform shows that report generation times dropped 40% after a tuning initiative, the ROI of performance work becomes concrete. MIS reporting tied to database performance data helps management prioritize optimization work that delivers measurable business impact.
Performance data presented in before-and-after comparisons is particularly useful. Annotated charts showing query response times dropping from 8 seconds to 0.2 seconds after an indexing change communicate value faster than any spreadsheet.
The database monitoring software market reached $2.4 billion in 2024, reflecting how central this capability has become. Choosing the right database monitoring tool for an ERP environment like LOGIC ERP requires evaluating several must-have capabilities:
Organizations should look for database performance management tools that support multiple database technologies rather than locking into a single-vendor solution. The trade-off between open-source tools (lower cost, customizable) and commercial database monitoring software (better support, polished UX, AI-driven features) depends on team size, budget, and criticality of the database environment.
A practical selection process: define performance goals and SLAs, shortlist 3-4 monitoring solutions, run a 2-4 week proof of concept in a staging or non-critical production database system, then standardize across environments.
Combining the features described above into a repeatable process turns database performance management from a project into a discipline. The core loop is straightforward:
Concrete best practices for database administrators and ERP implementation teams:
LOGIC ERP implementation teams can collaborate with customer database administrators to align performance goals with business cycles. Financial closing periods, seasonal sales peaks, and GST filing deadlines each impose different workload patterns. Planning resource allocation around these cycles prevents the scramble that comes from discovering capacity limits during the busiest week of the quarter.
Database monitoring helps organizations see what their database systems are doing. Database performance management turns that visibility into action: faster applications, fewer incidents, efficient resource utilization, and a stronger security posture. The gap between collecting performance metrics and actively using them for ongoing database performance optimization is the gap between firefighting and prevention.
As organizations grow in data volume and user count, disciplined database performance management becomes a strategic necessity. A database environment that handled 100 concurrent users and 50 GB of data will not perform the same way at 1,000 users and 500 GB without structured monitoring, analysis, tuning, and capacity planning.
Evaluate your current monitoring system against the features outlined in this guide. If your team spends more time reacting to outages than preventing them, consider adopting integrated performance management practices. Whether you run LOGIC ERP or another business-critical platform, the path to optimal database performance starts with measuring the right metrics, acting on what they reveal, and building a repeatable process that scales with your business.
Call at +91-73411-41176 / +91-73411-41175 or send us an email at sales@logicerp.com to book a free demo today!
The best database monitoring solutions provide real-time visibility into database health, query performance, and resource utilization. Leading tools support multiple database engines, offer customizable alerting, and include features like query execution analysis and capacity planning. These solutions help prevent downtime, reduce bottlenecks, and optimize performance for business-critical applications.
Database indexing creates data structures that speed up data retrieval by allowing queries to find data without scanning entire tables. Proper indexing reduces query execution time significantly, improves throughput, and lowers CPU and disk I/O usage. Maintaining indexes regularly prevents degradation and ensures efficient query plans.
Ensuring optimal database performance involves continuous monitoring of key performance metrics, tuning slow queries, maintaining indexes, managing resource utilization, and planning capacity. Using automated monitoring tools with alerting and root-cause analysis capabilities enables proactive issue detection and resolution to maintain high availability and responsiveness.
Common database performance issues include slow query execution, high CPU utilization, disk I/O bottlenecks, insufficient indexing, and locking or concurrency conflicts. Identifying and addressing these issues with monitoring tools and optimization techniques helps maintain smooth database operations.
Key performance metrics include query execution time, throughput (transactions per second), CPU and memory utilization, disk I/O latency, cache hit ratio, lock wait times, and error rates. Monitoring these metrics provides insights into database health and helps detect bottlenecks early.
Query execution plans show how a database engine retrieves data for a query. Efficient plans use indexes and minimize scans, reducing execution time and resource consumption. Analyzing execution plans helps identify inefficient queries and guides optimization efforts to improve overall database performance.
Database parameters control configuration settings like memory allocation, connection limits, and cache sizes. Properly tuning these parameters based on workload characteristics enhances resource utilization and query responsiveness, contributing to better overall performance.
Security features such as encryption, auditing, and access controls add overhead to database operations by increasing CPU usage and I/O demands. Effective performance management balances security requirements with optimization strategies to minimize impact while maintaining data protection.
Database monitoring tools offer functions including real-time performance tracking, query analysis, alerting, capacity planning, and root-cause diagnostics. They often integrate with application performance monitoring to correlate database activity with user experience.
Efficient data storage management involves using appropriate storage technologies, optimizing disk I/O, implementing partitioning or sharding, and maintaining indexes. These practices reduce latency, improve throughput, and support scalability as data volumes grow.
Slow query execution refers to the prolonged time taken by a database to complete SQL queries, which can significantly impact the responsiveness and throughput of database-driven applications. Identifying and managing slow queries is essential for maintaining efficient database operations and ensuring that key performance metrics remain within acceptable thresholds.
Slow query execution can be detected by monitoring key database performance metrics such as query execution time, CPU utilization, disk I/O latency, and throughput. Advanced database performance management tools provide real-time visibility into these metrics, enabling administrators to pinpoint problematic queries. Optimization techniques include rewriting inefficient queries, applying appropriate indexes, caching frequently accessed data, and performing regular index maintenance to improve query execution times and overall database efficiency.
Optimizing database queries involves rewriting inefficient SQL statements to reduce execution time, using appropriate indexes to speed up data retrieval, and caching frequently accessed data to minimize database load. Regularly reviewing query execution plans helps identify bottlenecks and improve performance.
Database functions perform operations on data within the database, such as calculations, data transformations, and aggregations. Efficient use of these functions can reduce the amount of data transferred between the database and applications, improving system responsiveness and reducing resource consumption.
Ensuring optimal performance includes continuous monitoring of key metrics like CPU usage, memory, and disk I/O, tuning slow queries, maintaining indexes, managing resource utilization, and planning for capacity growth. Automation and alerting tools also help proactively detect and resolve issues.
Db performance monitoring provides real-time visibility into database operations, helping identify slow queries, resource bottlenecks, and errors before they impact users. It supports proactive maintenance, capacity planning, and ensures high availability and responsiveness of database systems.
Popular Products