Marginal Cost Guide

What is Marginal Cost?

Formula, Calculation, Examples, and Business Applications

Learn what marginal cost means, how to calculate it using the formula, practical business examples, and how ERP software helps businesses track costs and profitability.
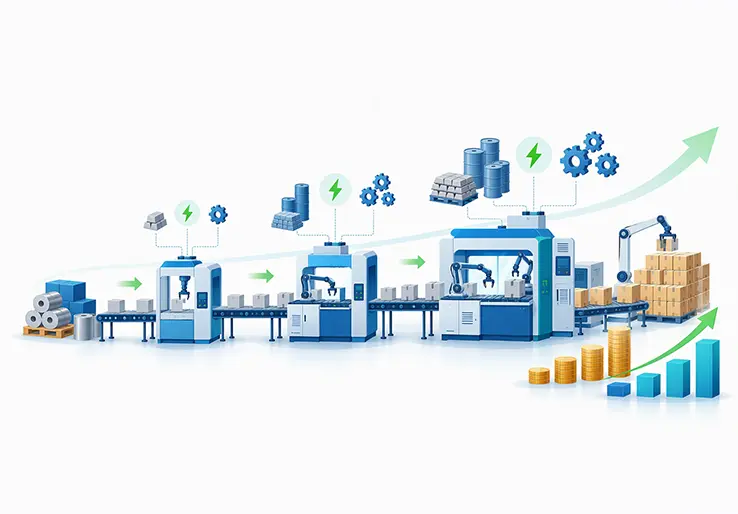
What is Marginal Cost? Formula, Calculation, Examples, and Business Applications

✨ Summarize this article with AI

Introduction

Every production decision comes down to one question: does making one more unit add more to your revenue than it adds to your cost? That question is the essence of marginal cost — and understanding it separates profitable operations from those that bleed money at scale.

This guide walks you through what marginal cost means, how to calculate it, worked examples across manufacturing, retail, and distribution, and how ERP software helps you track these numbers in practice.

What is Marginal Cost?

Marginal cost refers to the change in total cost that results from increasing production output by one or more units. The formal relationship is straightforward: if your total production cost rises when you produce more, the difference — divided by the number of additional units produced — is your marginal cost.

The concept rests on a fundamental distinction between fixed and variable costs. Fixed costs (factory rent, equipment depreciation, salaried management) do not change when you produce a few hundred more units in a given month. Variable costs (fabric for a garment, electricity consumed by machines, direct labor hours, packaging) rise directly with output. Marginal cost excludes fixed costs that do not change with the production of one extra unit and focuses on the variable portion.

This matters because it answers concrete operational questions. A manufacturer asking "Should we produce 10,000 units or 11,000 units this month?" needs to know if the additional revenue from 1,000 more units exceeds the additional cost. A retailer deciding whether to extend store hours for a sale weekend needs the same clarity.

Key distinctions to keep in mind:

  • Marginal cost focuses on the next unit or batch, not all units produced.
  • Total cost covers everything — fixed and variable — across all production.
  • Average cost is total costs divided by total quantity produced, giving a per-unit view across the entire output.
  • Understanding marginal cost helps you isolate the cost incurred when producing just the incremental output, which is where real profit decisions live.

Key Components of Marginal Cost

Marginal cost is driven mainly by variable production costs and semi-variable items, not by fixed overheads that are locked in for a period. The key components include:

  • Additional Raw Materials and Direct Materials — fabric for a textile unit, milk solids for a dairy processor, electronic components for an LED manufacturer.
  • Incremental Direct Labor — extra worker-hours or piece-rate wages for additional production.
  • Machine Running Time and Power — electricity, fuel, or LPG consumed per additional batch. In India’s QSR sector, a 50% LPG price hike raised the variable marginal costs of cooking each meal significantly, compressing margins by an estimated 150 basis points.
  • Packaging — for FMCG firms, packaging cost inflation of 15–20% directly increases the cost of producing each additional pack.
  • Incremental Distribution Expenses — extra fuel, tolls, and handling for delivering more cartons.

Some costs step up at thresholds. A factory may need a new supervisor after crossing 5,000 units, or overtime rates may kick in beyond 8 hours. These step costs cause marginal cost rises at specific production levels and must be factored in.

Marginal Cost Formula and How to Calculate Marginal Cost

The marginal cost formula is:

Marginal Cost = Change in Total Cost ÷ Change in Quantity

Here is how each component works:

  • Change in total cost is the difference between total cost before and after the output change. Because fixed costs remain constant in the short run, this change captures only variable production costs — materials, labour, utilities, packaging — plus any step costs triggered by the increase.
  • Change in quantity is the difference in units produced (e.g., from 1,000 to 1,400 units means ΔQ = 400).

To calculate marginal cost step by step:

  1. Record total cost at the current production volume (include all fixed and variable costs).
  2. Increase production output and record the new total cost.
  3. Compute the change in total cost (new total cost minus original total cost).
  4. Divide by the change in quantity (additional units produced).

A simple example: if total cost increases from $1,000 to $1,009 for one more unit, marginal cost is $9.

The marginal cost formula focuses on variable costs, not fixed costs, because the fixed portion cancels out when you subtract. However, consistency matters — you must measure both cost and output over the same production range, same time period, same plant, and same product. Mixing data across plants or months will distort your cost of goods sold calculation and your marginal cost calculation.

Worked Marginal Cost Calculation Examples

These examples use the marginal cost formula with realistic numbers to show how marginal cost behaves across different business types.

Example 1: Marginal Cost in Manufacturing

An LED light factory in Gujarat produces 10,000 units in April 2026 at a total production cost of ₹9,00,000. In May, it increases production to 12,000 units. The new total cost is ₹10,20,000.

  • Change in total cost: ₹10,20,000 − ₹9,00,000 = ₹1,20,000
  • Change in quantity: 12,000 − 10,000 = 2,000 units
  • Marginal cost: ₹1,20,000 ÷ 2,000 = ₹60 per additional unit

The ₹60 covers extra LED components, additional assembly labour, machine power, and packaging. Factory rent didn’t change — it’s a fixed cost spread across more units, which is why the average cost per unit actually decreased.

Example 2: Marginal Cost in Retail

A grocery retailer sells 5,000 units of a packaged snack monthly. A promotional campaign pushes demand to 6,000 units. The incremental cost includes:

  • Extra procurement: ₹18 per unit × 1,000 = ₹18,000
  • Marketplace listing and payment gateway fees: ₹2 per unit × 1,000 = ₹2,000
  • Last-mile delivery (for online orders): ₹5 per unit × 1,000 = ₹5,000

Total additional cost: ₹25,000. Marginal cost per extra unit: ₹25,000 ÷ 1,000 = ₹25 per unit. If the selling price is ₹35, the incremental revenue per unit exceeds the marginal cost, making the promotion worthwhile.

Example 3: Marginal Cost in Distribution

A distributor adds 50 more store deliveries on an established weekly route. Extra costs:

  • Additional fuel: ₹4,500
  • Driver overtime (3 extra hours): ₹1,500
  • Tolls and vehicle wear: ₹1,000

Total additional cost: ₹7,000. Marginal cost per extra delivery: ₹7,000 ÷ 50 = ₹140 per delivery.

These examples illustrate two important points:

  • Marginal cost varies significantly by product, channel, and production volume. An online order has different variable costs than an in-store sale.
  • Capacity utilisation matters. The LED factory’s marginal cost of ₹60 may jump to ₹80 if it crosses shift capacity and triggers overtime.

Marginal Cost Curve, Cost Curve Shape, and Economies of Scale

If you plot quantity produced on the x-axis and marginal cost on the y-axis, you get the marginal cost curve. The marginal cost curve is typically U-shaped due to economies of scale on the left side and diseconomies on the right.

Why marginal cost falls initially:

  • Economies of scale — bulk purchases of raw materials bring lower marginal costs per unit, setup costs get spread, and production efficiency improves.
  • Learning effects — workers and processes get faster and waste less.
  • Marginal cost decreases as production increases due to these efficiency gains.
  • Marginal costs may decrease due to improved efficiency or increased production capacity.

Why marginal cost rises after a point:

  • Bottlenecks — machines hit capacity, workers crowd production lines.
  • Overtime and shift premiums — marginal costs may increase when capacity constraints or overtime pay are required.
  • Diminishing returns occur when production exceeds optimal efficiency levels, meaning each extra unit of input produces less additional output.
  • Maintenance and downtime increase as equipment runs beyond optimal hours.

Understanding marginal cost helps companies evaluate economies of scale versus diseconomies of scale. Practically, this means asking: "At what production output does our factory run most efficiently, and when do cost savings stop?"

The marginal cost curve also relates directly to the average cost curve. When marginal cost is below average cost, average cost falls. When marginal cost is above average cost, average cost rises. The two curves intersect at the minimum point of the average cost curve — the optimal production level where per-unit cost is lowest. In economic theory, firms expand output up to the point where producing one more unit no longer improves efficiency.

Investing in fixed assets — a new machine, a larger warehouse — can help reduce rising marginal costs by shifting the capacity constraint and flattening the right side of the cost curve.

Marginal Cost vs Average Cost and Other Related Concepts

Average cost (or average total cost) equals total cost divided by total quantity produced. Average variable cost is total variable costs divided by units produced. Both give a per-unit view, but they smooth over the differences between individual units.

How marginal cost and average cost differ:

FactorMarginal CostAverage Cost
MeaningAdditional cost of producing one more unitTotal cost per unit across all production
FormulaChange in total cost ÷ change in quantityTotal cost ÷ total quantity
PurposeEvaluating whether to increase or decrease outputUnderstanding overall cost efficiency
Decision useAccept/reject orders, set floor priceAssess profitability, benchmark cost structure

The relationship between these two is important. Marginal cost pulls average cost in its direction: when the cost of the next unit is cheaper than the current average, the average drops. When it’s more expensive, the average rises.

Marginal cost versus marginal revenue is equally critical. Marginal revenue is the additional revenue earned from selling one more unit. Production efficiency peaks when marginal cost equals marginal revenue — that is the profit-maximizing production level. In perfectly competitive markets, the market price equals marginal cost, so firms produce until their cost of production matches the going rate.

If marginal cost exceeds market price, production should be reduced because each additional unit loses money. Conversely, if marginal revenue still exceeds marginal cost, there is room for further production to maximize profits.

Business Uses of Marginal Cost Analysis

Marginal cost analysis is crucial for maximizing profits and resource allocation. Here are the core applications:

  • Pricing Strategies — knowing marginal cost lets you set a floor price for any product or order. Understanding marginal cost aids in setting competitive prices and helps determine optimal pricing strategies. You can use your profit and loss formula to validate whether incremental revenue from a price cut still covers costs.
  • Special Order Evaluation — companies use marginal cost to determine whether to accept special orders at discounted prices. If the offered price exceeds the marginal cost, the order contributes to covering fixed costs and generating profit, even at a lower-than-usual margin.
  • Production Planning — marginal cost helps determine the optimal production level for maximizing profits. Businesses use marginal cost to determine optimal production levels and the optimal production quantity for each product line.
  • Budgeting and Forecasting — understanding marginal cost aids in budgeting and financial planning by letting you estimate the cost of increasing production by, say, 20% next quarter.
  • Cost Control — marginal cost analysis can identify inefficiencies in production processes. Comparing marginal costs across plants, shifts, or product lines reveals where manufacturing costs are out of line.
  • Resource Allocation — marginal cost helps optimize resource allocation across business lines. Resource allocation decisions are influenced by marginal cost calculations — you direct capital and capacity toward products with the most favourable gap between marginal revenue and marginal cost.
  • Expansion or Reduction — marginal cost analysis informs decisions on production expansion or reduction. If sales revenue from more units cannot cover total costs at the expanded level, scaling back is the rational choice.
  • Product Mix — optimizing production levels across multiple SKUs requires comparing marginal cost and contribution margins by product to decide which items deserve more capacity.

Marginal Cost in Different Industries and Functions

Marginal cost behaves differently across industries, but the underlying concept is the same: the change in total cost over the change in quantity.

Manufacturing:

  • Key drivers are direct materials consumption, machine hours, setup costs, and lot sizes. A textile manufacturing unit in Ludhiana increasing shirt production ahead of Diwali 2026 will see marginal cost fall initially as fabric is bought in bulk, then rise as overtime and machine maintenance increase. Batch-level costing captures these shifts.

Retail:

  • Marginal cost includes procurement cost per extra unit, shelf space allocation, store staff overtime, and last-mile delivery for online orders. The marginal cost of an extra online sale often differs from an in-store sale because of packaging, shipping, and return-handling costs. A supermarket ERP system that tracks per-order costs can surface these differences.

Distribution and Logistics:

  • Fuel, driver time, vehicle capacity, and tolls drive incremental cost per stop. Route optimisation changes the marginal cost per delivery — a well-planned route absorbs extra stops at lower cost than a scattered one. Distribution management software helps quantify these trade-offs.

E-commerce and Omnichannel:

  • Variable cost components include packaging, payment gateway fees, marketplace commissions, returns processing, and customer service interactions. Each of these represents an additional cost that scales with order volume. For omnichannel retailers, comparing the cost curve for online versus offline channels reveals where to focus growth.

Limitations and Risks of Marginal Costing and Marginal Cost Analysis

Marginal costing is a powerful costing method, but it has real limitations that managers should recognise before relying on it exclusively.

  • Fixed Costs are Not Always Fixed. Marginal costing assumes fixed costs remain constant, but rapid growth may require new equipment, additional shifts, or a larger facility — at which point previously fixed costs change and the cost structure shifts.
  • Cost Classification is Subjective. Separating costs into fixed and variable categories is not always clean. Overtime, maintenance, and mixed utility bills sit in grey areas. Misclassifying them distorts your marginal cost calculation.
  • Ignores Long-Term Strategy. Focusing only on whether incremental revenue covers marginal cost can lead to underpricing, brand erosion, or underinvestment. Period costs and strategic investments in R&D, branding, or capacity may be neglected.
  • Historical Data May Mislead. Marginal cost analysis uses past or current cost data. Sudden spikes in raw materials or freight rates — like those caused by supply chain disruptions in 2025–2026 — can make yesterday’s marginal cost a poor predictor of tomorrow’s.
  • Not Suitable for External Financial Reporting. Absorption costing (which allocates fixed overheads per unit) is required for statutory reporting in most jurisdictions. Direct costing or marginal costing is an internal management tool, not a replacement for full cost accounting in financial statements.

How ERP Systems Help Track Marginal Costs, Average Costs, and Cost Curves?

Accurate marginal cost analysis depends on having up-to-date data on total cost, quantity produced, and how costs change with output. ERP systems consolidate this data across procurement, production, inventory and sales.

How integrated ERP data streamlines the process:

  • Material Consumption Tracking — inventory management software records exact quantities of raw materials consumed per batch, giving you precise variable cost inputs.
  • Labour and Machine Time — production management modules capture direct labor hours, machine run times, and shift data, all of which feed into marginal cost calculation.
  • Freight and Delivery Costs — order-level cost capture lets you see the incremental cost of each delivery, route, or customer.
  • Average Cost Monitoring — ERP reports can show average cost trends over months, plants, and product categories, making it easy to spot when marginal cost crosses above average cost — a signal that production efficiency is declining.
  • Scenario Modelling — with reliable baseline data, finance teams can model what happens to costs if production increases by 10% or if a key input price rises by 15%.

How LOGIC ERP Supports Marginal Cost Visibility and Cost Management?

LOGIC ERP is designed for manufacturers, retailers, and distributors who need to understand and manage their cost of production at a granular level. Its integrated modules — covering FMCG manufacturing, inventory, procurement, sales, and accounting — provide the underlying cost and quantity data used in marginal cost analysis.

Practical applications:

  • A food-processing firm can use LOGIC ERP to compare the marginal cost of running night shifts versus outsourcing to a co-packer, using actual material consumption and labour data from the system.
  • A fashion retailer can analyse the marginal cost per online order versus per store sale by pulling transaction-level data from retail POS and fulfilment modules.
  • MIS dashboards surface cost variations across product lines, plants, and periods — giving finance and operations teams the valuable insights they need to optimize production and reduce costs before margins erode.
  • Contribution margin reports help identify which products cover costs and which drag down profitability.
Better cost visibility starts with connected business data. If you’re making production, pricing, or expansion decisions without clear marginal cost data, you’re flying blind.

Improving Cost Decisions with Marginal Cost Analysis and LOGIC ERP

Understanding marginal cost, average cost, and cost curves gives businesses the clarity to decide how much to produce, what to charge, and which orders to accept. Without this analysis, pricing strategies rely on guesswork, and production decisions risk eroding margins.

Here are your next steps:

  • Review your current cost structure and classify each expense as fixed or variable.
  • Calculate marginal cost for your highest-volume products using the formula and your actual cost data.
  • Compare marginal cost against sales revenue per unit to confirm that every additional unit produced is actually profitable.
  • Evaluate whether your current systems give you the timely, accurate data that marginal cost analysis requires.

LOGIC ERP brings procurement, production, inventory and financial data together so you can track costs at the level of detail that matters. If your current tools leave you guessing about the true cost of your next unit, it may be time for a change.

Call at +91-73411-41176 / +91-73411-41175 or send us an email at sales@logicerp.com to book a free demo today!

Frequently Asked Questions About Marginal Costs

Marginal cost is the additional cost a business incurs to produce one more unit of a product. It includes only variable costs that change with output, such as raw materials and labor, excluding fixed overheads.

To calculate marginal cost, use the formula: Marginal Cost = Change in Total Cost ÷ Change in Quantity. Measure total cost before and after increasing production, find the difference, and divide by the number of additional units produced.

Average cost is the total cost divided by total quantity produced, giving the cost per unit across all output. Marginal cost focuses on the cost of producing just the next unit. Both metrics serve different roles in cost accounting and decision-making.

Yes. When marginal cost is below average cost, producing additional units lowers the average cost. This typically occurs at lower production levels before diminishing returns increase costs.

No. Fixed costs do not change with production levels and are excluded from marginal cost. Marginal cost captures only variable production costs and any step costs triggered by increased output.

A marginal cost curve plots marginal cost against production quantity. It is usually U-shaped, falling initially due to economies of scale and rising later as capacity limits and diminishing returns increase costs.

Marginal costing treats fixed overheads as period costs and focuses on variable costs for contribution analysis, used for internal decisions. Absorption costing allocates fixed overheads to each unit and is typically required for external financial reporting.

ERP software centralizes procurement, production, inventory, and sales data, enabling accurate tracking of cost changes with output. This provides reliable inputs for marginal cost calculations, average cost monitoring, and identifying rising production costs.

Logic ERP Bot