Gain complete visibility into key financial components including revenue, operating costs, expenses, taxes, interest, and net profit or loss. Make smarter financial decisions by analyzing performance trends and comparing current results with previous periods. Identify growth opportunities, control costs, and keep your business on a profitable path with data-driven insights. Get the P&L statement with LOGIC ERP to identify whether your business is generating profit or incurring a loss by comparing total revenue against total expenses.
P&L Guide
The P&L statement is one of three essential financial statements that every public company issues, alongside the balance sheet and cash flow statement. Creating a P&L statement is as easy as generating invoices for your customers based on their purchases. You can avoid multi-step, time-consuming operations and understand your business better. Steps to create Retail P&L statement are mentioned below:
Select a monthly, quarterly, or annual reporting p period to generate an accurate financial snapshot. Retailers commonly review P&L statements monthly, while annual reports support statutory and tax requirements.
Access Reports > Financial Statements > Profit and Loss Account in LOGIC ERP to generate P&L accounts, trading accounts, company P&L reports, and supporting financial statements.
COGS includes direct costs linked to producing goods sold. LOGIC ERP integrates inventory management with accounting so opening stock, purchases, freight, stock adjustment, & closing inventory can be used for accurate COGS.
Operating Expenses, or OPEX, are indirect costs like rent, marketing, and salaries. LOGIC ERP can classify rent, salaries, utilities, advertising, insurance, depreciation, freight, administrative costs, and other indirect expenses under the correct expense heads.
LOGIC ERP supports one-click generation of trading account, P&L account, and balance sheet formats. Users can select a p&l sheet, p&l statement, pnl format, profit & loss account format, or trading & profit & loss account format depending on reporting needs.
Automated GST calculations help ensure compliance with applicable tax regulations. Income tax, GST ledgers, purchase tax, output tax, and input credits can be reviewed before finalizing the profit and loss statement.
The final report can be exported as Excel or a profit and loss account format PDF for management review, bank loan applications, investor communication, or audit documentation.
Review profit trends, monitor expenses, and gain valuable financial insights to support smarter business decisions. Compare profit and loss across different periods to identify growth trends and improve business planning.
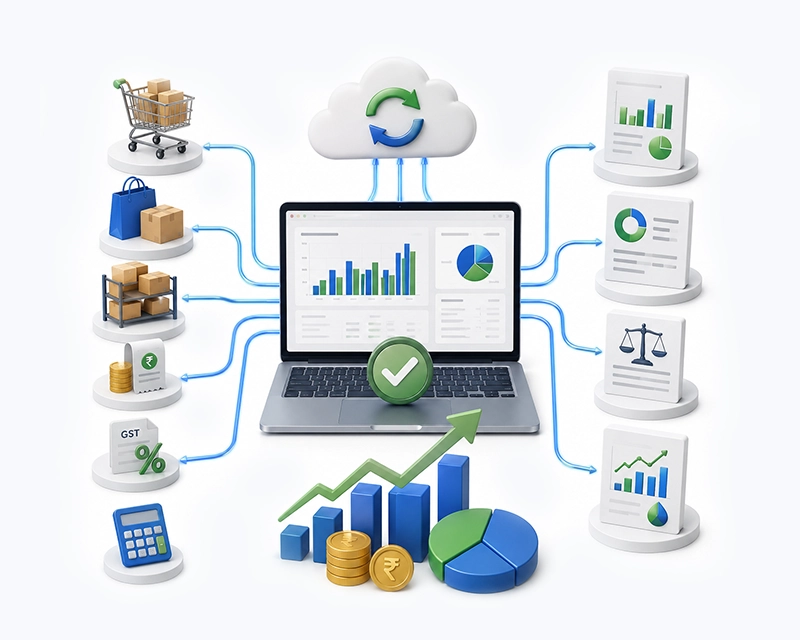
LOGIC ERP integrated accounting software automates GST and financial calculations to deliver powerful, error-free business statements like Profit & Loss, Income Statement, Balance Sheet, and Cash Flow all without manual effort or extra workforce. By seamlessly connecting sales, purchases, inventory, expenses, GST, and accounting data in one unified system, it eliminates errors and ensures real-time financial accuracy.
BUSINESS VALUE
LOGIC ERP supports GST-ready reporting, helping businesses prepare profit and loss, tax summaries, and compliance documents with fewer manual errors.
Sales invoices, purchase entries, returns, expenses incurred, payment records, and stock adjustments update accounting reports in real time. This allows owners to monitor business profit and financial results before month-end.
Businesses can generate vertical format of profit and loss account, horizontal format, p&l account format, pl format, pnl format, p and l account format, company profit loss account format, and company-specific templates.
Validation helps prevent common accounting mistakes such as incorrect GST classification, missing depreciation entries, and mismatched ledger balances.
Cloud access enables anytime, anywhere financial reporting for owners, accountants, and finance teams managing one store or many store locations.
Users can export financial statements in Excel or PDF, including profit and loss account format PDF, trading p&l and balance sheet format, p&l and balance sheet format, and reports required for banks or stakeholders.
LOGIC ERP allows controlled access for accountants, finance managers, auditors, and business owners, ensuring secure financial reporting and better data confidentiality.
Retail profitability depends on accurate goods sold calculations. LOGIC ERP links inventory with accounting so COGS, stock adjustment, closing inventory, and gross profit can be calculated more reliably.
LOGIC ERP provides detailed profit analysis by product, category, store, brand, customer, or location, helping businesses identify high-performing areas and improve profitability decisions.
Customer Reviews
Trusted by top retail franchise networks — see how LOGIC ERP transforms multi-location operations.
Business Need
The Profit and Loss (P&L) statement is a financial report that evaluates a business’s financial performance by comparing the revenue earned with the expenses incurred over a specific period. It provides a clear summary of profitability, helping businesses understand whether they are operating at a profit or loss. Based on this insight, decision-makers can take strategic actions such as increasing revenue, reducing costs, or both to improve overall financial stability and growth.
Importance
The primary purpose of a Profit and Loss (P&L) statement is to evaluate a company’s income and expenses over a financial year or any defined period. It highlights the business’s ability to generate revenue, control costs, and achieve profitability. The P&L statement is also regarded as one of the key financial reports essential for understanding a company’s overall financial performance.
The primary purpose of a profit and loss statement is to provide stakeholders with a clear understanding of a business’s financial performance, indicating whether it is generating a profit or incurring a loss. It helps owners, management, investors, lenders, and analysts evaluate the company’s profitability over a particular period.
It tracks business performance, total profit, net profit, operating income, gross margin, and revenue growth over time.
It helps identify profitable products, services, branches, departments, and customer segments.
P&L reports are used for income tax filing, audit support, GST reconciliation, and statutory reporting.
Budgeting and forecasting can be established by comparing P&L statements across different periods.
Lenders and investors require P&L statements to evaluate a company’s financial stability. Investors review P&L statements to judge a company’s future profit potential.
Investors and analysts use P&L statements to evaluate a company’s financial health and growth potential, often comparing them with other financial documents like balance sheets and cash flow statements.
Importance of P&L
Retail stores need a profit and loss statement because sales alone do not prove profitability. A store may generate revenue and still lose money if discounts, returns, rent, salaries, inventory shrinkage, and other operating expenses are too high.
A retail P&L helps store owners answer practical questions:
Which products create profits?
Which categories have weak gross profit?
How much profit remains after rent, salaries, and marketing?
Are discounts improving sales but reducing net income?
Is the store’s financial health improving compared with previous years?
Can the company repay debt instruments, vendor credit, or bank loans?

A Profit and Loss (P&L) statement is essential to evaluate whether a company can sustain operations and to support future financial forecasting.
A retail P&L statement provides a clear analysis of actual business performance by considering revenues, expenses, and indirect overhead costs.
It helps improve cash flow management and provides better visibility for future expansion planning.
It identifies areas where cash is locked, enabling better decisions on optimizing or scaling resources such as employees, inventory, and facilities.
Comparing P&L statements across different periods helps evaluate performance trends and identify key factors for faster business growth.
Retailers must maintain updated P&L statements when applying for loans, overdrafts, or other credit facilities.
Banks and financial institutions analyze historical, provisional, and projected P&L statements to assess repayment capability, liability management, and debt servicing strength.
Preparing a Profit and Loss statement is mandatory for compliance with Income Tax and GST regulations.
It also helps businesses gain deeper financial insights and make more informed strategic decisions.
P&L Flow
The components of a profit and loss statement explain how a company moves from total sales to net profit. In a retail business, the components of a profit and loss account are usually arranged in a vertical format from revenue to final net income.
Net sales/Revenue is the total value of money that the company generates by selling its products, and services adjusting from the returned goods value.
Net sales = Total revenue generated - Return goods valueThe Cost Of Goods Sold (COGS) is a direct cost incurred in producing a finished product from the purchase of raw materials for the manufacturing sector or purchase of traded items in case of trading sector till the time it is ready for sale.
Cost Of Goods Sold = Opening stock + Purchases + Direct expense - Closing stockGross Profit is calculated as Revenue minus COGS, indicating core production efficiency.
Gross profit/loss = Total revenue generated by selling the products - Cost of selling the products.This helps in the easy identification of whether the selling price of the product can recover the basic procurement cost involved with a sufficient margin.
Direct expenses are expenses other than purchase costs that are directly incurred for the core business operations and it directly relates to the cost of production or acquisition of the product. Examples are freight inwards(freight on purchases), loading & unloading charges, factory wages, factory rent, etc.
They are essential costs that are indirectly involved in the smooth operation of business. Examples are administrative salaries, office rent, depreciation, office stationers/maintenance, insurance, advertisement, salesman commission, and much more.
Net profit is the actual profit or loss that a business has made over a financial period adjusting the indirect expenses and indirect income from the gross profit. This actually helps in easier identification of whether the business can generate returns from the investment made and detect where the business lags in generating profits.

P&L Format
A profit and loss statement format can be prepared in different ways depending on business size, reporting purpose, accounting standards, and stakeholder requirements. Businesses search for p&l format, p and l account format, profit and loss format, p&l account format, pl account, pnl format, profit & loss format, and format of profit and loss account because different use cases require different layouts.
01
The vertical format lists line items from top to bottom — the most common format for modern reporting.
This is the most common profit & loss statement format for modern reporting. In India, corporate financial statements are influenced by Schedule III under the Companies Act 2013. A company profit loss account format or company profit and loss account may need to follow Schedule III presentation and disclosure rules.
02
The horizontal format, also called T-shaped format, places debit items and credit items side by side. It is commonly seen in accounting education and traditional profit and loss account images.
A horizontal P&L may show expenses on one side and income on the other. The same idea appears in a t shape balance sheet, although a balance sheet reports assets, liabilities, and equity rather than profitability.
This format is easy for small businesses, owner-managed stores, and basic loss statement template use cases.
The multistep method categorizes revenues and expenses into operating and non-operating items, allowing for a more detailed analysis of financial performance, making it ideal for larger businesses.
A multi step income statement typically calculates:
P&L statements can be prepared using either a single-step method, which summarizes revenues and expenses in one calculation, or a multi-step method, which provides a detailed breakdown of operating and non-operating items.
03
A trading & P&L account format combines the trading account and profit and loss account. The trading account calculates gross profit from sales and cost of goods sold, while the P&L account calculates net profit after indirect expenses and other income.
This is useful for retailers that want a trading p&l, trading and p&l account format, trading & profit & loss account format, or trading p&l and balance sheet format.
04
A proforma of profit and loss account — also called performa of profit and loss account, or profit and loss account proforma — is used for planning, budgeting, forecasting, loan applications, and projected financial results.
LOGIC ERP can help businesses maintain
| Aspect | Profit and Loss Statement (P&L) | Balance Sheet |
|---|---|---|
| Definition | Shows a company’s income, expenditures, and profitability over a specific period. | Provides a snapshot of the company’s assets, liabilities, and equity at a particular moment in time. |
| Time Coverage | Covers a specific period such as a month, quarter, or fiscal year. | Shows financial position at a specific date. |
| Purpose | Measures financial performance and business profitability over time. | Shows financial position and financial strength at a point in time. |
| Content | Includes revenue, cost of goods sold (COGS), gross profit, operating expenses, other income, and net income. | Includes company’s assets, liabilities, equity, and working capital. |
| Nature | Flow statement (reports changes over a period). | Position statement (reports balances at a point in time). |
| Frequency | Often reviewed monthly, quarterly, or annually. | Typically prepared at period-end (quarterly or annually). |
| Link Between Statements | Net profit from P&L flows into retained earnings on the balance sheet. | Retained earnings appear in equity section, reflecting accumulated net income or loss. |
| Use for Stakeholders | Helps owners, investors, lenders, and analysts evaluate profitability and operational efficiency over time. | Helps assess company’s financial strength, liquidity, and solvency at a specific date. |
| Relation to Other Statements | Used alongside balance sheet and cash flow statement for comprehensive financial analysis. | Used with P&L and cash flow statements to understand overall financial health. |
| Examples | Profit and loss balance sheet example and profit & loss account and balance sheet examples illustrate connections. | Same examples show relationship between net income, retained earnings, assets, and liabilities. |
P&L Steps
You can prepare a retail store P&L format in Excel by creating a structured spreadsheet with sections for sales, cost of goods sold, gross profit, operating expenses, other income, and net profit. This profit and loss statement template excel structure is useful for small businesses that do not yet use ERP, although LOGIC ERP is more efficient for automated reporting.
Add the company name, report title, branch name, and reporting period. For example: “Retail Profit and Loss Statement for April 2026.”
Include gross sales, returns, discounts, allowances, and net sales.
Include opening inventory, purchases, freight inward, purchase returns, stock adjustment, and closing inventory.
Use:=Net Sales - COGS
Include rent, salaries, utilities, advertising, software, insurance, depreciation, and other store expenses.
Include interest income, miscellaneous income, interest expense, and non-recurring expenses.
Use:=Gross Profit - Operating Expenses + Other Income - Other Expenses - Tax
Add current month, previous month, same period last year, budget, and variance columns.
Use common-size formulas to show each line item as a percentage of revenue: Line Item % = Line Item / Net Sales × 100
Use currency formatting, bold subtotal rows, borders, and charts for performance analysis.
Specimen
Profit and loss account examples help show what a P&L looks like in real business situations. Below are simplified examples for retail reporting.
| Particulars | Amount |
|---|---|
| Gross Sales | ₹10,00,000 |
| Less: Returns and Discounts | ₹50,000 |
| Net Sales | ₹9,50,000 |
| Cost of Goods Sold | ₹5,70,000 |
| Gross Profit | ₹3,80,000 |
| Operating Expenses | ₹2,20,000 |
| Other Income | ₹10,000 |
| Interest Expense | ₹15,000 |
| Income Tax | ₹35,000 |
| Net Profit | ₹1,20,000 |
This profit and loss account example shows how net sales, COGS, gross profit, operating expenses, and net income connect in a retail store.
| Store | Net Sales | Gross Profit | Operating Expenses | Net Profit |
|---|---|---|---|---|
| Store A | ₹18,00,000 | ₹7,20,000 | ₹4,50,000 | ₹2,70,000 |
| Store B | ₹12,00,000 | ₹4,20,000 | ₹3,80,000 | ₹40,000 |
| Store C | ₹20,00,000 | ₹8,00,000 | ₹5,20,000 | ₹2,80,000 |
| Consolidated | ₹50,00,000 | ₹19,40,000 | ₹13,50,000 | ₹5,90,000 |
This format helps compare business performance across branches and identify which locations need expense control or pricing improvement.
| Quarter | Net Sales | COGS | Gross Profit | Net Profit |
|---|---|---|---|---|
| Q1 | ₹8,00,000 | ₹4,80,000 | ₹3,20,000 | ₹60,000 |
| Q2 | ₹6,50,000 | ₹4,00,000 | ₹2,50,000 | ₹20,000 |
| Q3 | ₹11,00,000 | ₹6,20,000 | ₹4,80,000 | ₹1,30,000 |
| Q4 (Peak) | ₹18,00,000 | ₹9,80,000 | ₹8,20,000 | ₹3,10,000 |
The P&L statement can be used for trend analysis by comparing financial performance over time. Seasonal retailers use this report for buying plans, staffing, discounts, and cash flow planning.
An e-commerce P&L may include online-specific costs such as marketplace commission, payment gateway fees, shipping charges, packaging, returns, digital ads, and fulfillment expenses.
| Particulars | Amount |
|---|---|
| Online Sales | ₹15,00,000 |
| Returns | ₹1,20,000 |
| Net Sales | ₹13,80,000 |
| COGS | ₹7,50,000 |
| Gross Profit | ₹6,30,000 |
| Marketplace Commission | ₹1,10,000 |
| Shipping & Packaging | ₹90,000 |
| Digital Marketing | ₹1,40,000 |
| Other Operating Expenses | ₹1,20,000 |
| Net Profit | ₹1,70,000 |
This example shows why modern retail P&L formats must include channel-specific cost lines.
A traditional profit and loss account may use a horizontal or T-shaped layout. A modern ERP-generated statement usually uses a vertical format with comparative columns, margins, and drill-down reports.
Businesses may use profit and loss account images, images of profit and loss statement, and profit and loss balance sheet example references for learning. For decision-making, however, real-time ERP reports are more useful than static images.
This profit and loss statement example is divided into two sections: the Trading account in the first half and the P&L account in the second half. The trading account begins with the opening stock entry on the debit side, followed by adjustments for net purchases and other freight charges related to procuring raw materials. On the credit side, net sales are adjusted by the closing stock value. By comparing the debit and credit sides, the gross profit or loss is determined.
Next, the gross profit or loss is transferred to the P&L account. If the trading account shows a gross profit, it is carried over to the credit side; if a gross loss, it is carried to the debit side. Subsequently, indirect incomes and expenses are recorded on the respective credit and debit sides. This process leads to the calculation of the net profit or loss, similar to how the gross profit or loss was determined
Welfare
A retail income statement gives owners and management a clear view of business profitability. It helps answer how much profit was made, which expenses increased, and whether the company’s income is growing faster than costs. Let's explore the top advantages of retail income statement generated by LOGIC ERP.
The P&L identifies the most and least profitable products, brands, departments, and stores, helping retailers focus on high-margin areas.
A low operating cost might be indicated by a negative net profit despite a favorable gross margin, guiding management to make decisions to reduce costs.
Helps in making decisions about where to reduce expenses, where cash flow gets blocked, and how to increase net profit.
A profit and loss statement directly evaluates the profitability of the business and compares it with past performance. It helps businesses track whether they are progressing on the right path and making the expected profit.
It forms the basis for future profit and loss statements to estimate projected profits and make better business decisions.
Assists in determining the ability to generate revenue over the long term.
Reveals revenue growth, margin shifts, seasonal fluctuations, and expense patterns over time for better forecasting.
Allows retailers to compare gross profit, operating margin, and net profit margins against industry standards or competitors to gauge performance.
Supports key decisions on expansion, new locations, inventory investment, hiring, and renovations by showing financial viability.
Tracks actual results against budgets and forecasts to ensure targets are met and strategies adjusted promptly.
Lenders and investors rely on P&L statements to assess a company’s financial health and creditworthiness before providing funding.
While distinct from cash flow statements, P&L reports help estimate cash needs when reviewed alongside balance sheets and cash flow data.
LOGIC ERP accommodates both methods, recording transactions when cash moves or when earned/incurred, fitting diverse business needs.
Automated P&L formats aid statutory compliance, tax filing, and investor reporting with accuracy and minimal manual effort.
Integrated sales, inventory, and accounting modules provide up-to-date financials, enabling timely and informed business decisions.
Generate vertical, horizontal, trading & P&L combined, proforma, and company-specific templates tailored to various reporting requirements.
Export P&L statements as PDFs, Excel files, and other formats for audits, bank submissions, and stakeholder communications.
Business Need
LOGIC ERP simplifies financial reporting with accurate, real-time Profit and Loss statements that help businesses clearly understand profitability at every level. It enables flexible reporting formats, including horizontal and vertical P&L views, along with group-wise summaries and detailed ledger analysis for deeper financial insights. With consolidated and location-wise reporting, businesses gain complete visibility across multiple branches, ensuring better decision-making, improved financial control, and faster, more reliable accounting processes.

Generate accurate Profit & Loss statements with LOGIC ERP and gain complete visibility into revenue, expenses, profitability, and financial performance for smarter business decisions.
FAQ
Get an Overview of Profit and Loss Statement by LOGIC ERP
A profit and loss statement is a financial report that shows a company’s income, expenses, and net profit or loss over a specific period. It is also called an income statement, P&L statement, p l statement, loss statement, operating statement, or profit and loss account.
To do a profit and loss statement, choose a reporting period, collect revenue and expense data, calculate net sales, calculate COGS, calculate gross profit, list operating expenses, add other income, subtract non operating expenses, interest expense, and income tax, then calculate net income.
In LOGIC ERP, go to Reports > Financial Statements > Profit and Loss Account, select the company, branch, and reporting period, choose the required profit and loss statement format, and generate the report. You can export it as Excel or PDF. Call at +91-73411-41176 / +91-73411-41175 or send us an email at sales@logicerp.com to book a free demo today!
Yes. An income statement is the same as a profit and loss statement. Terms such as P&L statement, profit and loss account, p and l account, P/L, pnl, operating statement, and income statement are commonly used for the same report.
PNL full form is Profit and Loss. In accounting, PNL format or p&l format refers to the layout used to show revenue, expenses, and net profit or loss.
To calculate a common size statement of profit and loss, divide each line item by net sales or total revenue and multiply by 100. For example, Gross Profit Percentage = Gross Profit / Net Sales × 100.
Read a P&L from top to bottom. Start with revenue, then net sales, COGS, gross profit, operating expenses, operating income, other income, non operating expenses, tax, and net profit. Also compare margins and trends across previous periods.
Create headings for revenue, COGS, gross profit, operating expenses, other income, tax, and net profit. Use SUM and subtraction formulas. Add percentage columns, comparison columns, and currency formatting. Excel works, but LOGIC ERP automates the process.
Net Sales = Gross Sales - Sales Returns - Discounts - Allowances. Net sales show the actual sales retained by the company after customer returns and reductions.
Analyze revenue trends, gross profit margin, operating expense ratios, net profit margin, seasonal changes, and unusual items. Compare the P&L with the balance sheet and cash flow statement for a complete view of the company’s financial health.
A trading account calculates gross profit by comparing net sales with cost of goods sold. A P&L account calculates net profit after deducting indirect expenses and adding other income. A trading & p&l account format combines both.
Retail businesses should prepare P&L statements monthly for internal control, quarterly for performance review, and annually for tax and statutory reporting. High-volume retailers may review daily or weekly dashboards in ERP.
Common ratios include gross profit margin, operating margin, net profit margin, expense ratio, EBITDA margin, and revenue growth rate. These ratios help evaluate company’s profitability and operational efficiency.
The purpose of profit and loss statement is to show whether a company made a profit or loss during a specified period. It helps management, investors, lenders, and tax authorities understand financial performance.
A profit and loss statement usually starts with revenue, then deducts COGS to show gross profit, deducts operating expenses to show operating income, adds other income, deducts tax and interest, and ends with net profit or net loss.
Depreciation is an operating expense that allocates the cost of a fixed asset over its useful life. It reduces accounting profit but does not involve immediate cash outflow in the same period.
Other income includes income not directly generated from normal sales, such as interest income, rental income, commission income, asset sale gains, or miscellaneous receipts.
Stock adjustment records changes in inventory due to shrinkage, damage, theft, physical stock differences, or valuation changes. It affects COGS and gross profit.
COGS = Opening Inventory + Purchases + Freight Inward + Direct Cost - Closing Inventory . In LOGIC ERP, this can be calculated from integrated purchase and inventory records.
Cash profit can be estimated by starting with net profit and adding back non-cash expenses such as depreciation and amortization. For deeper analysis, compare it with the cash flow statement.
Fill out sales first, then returns and discounts, COGS, gross profit, operating expenses, other income, interest, taxes, and net profit. Use supporting invoices, receipts, bank transactions, and ledger reports.
To make a statement of profit and loss, follow a structured format: revenue, cost of goods sold, gross profit, expenses, operating income, other income, tax, and net income. Businesses can use Excel, accounting software, or LOGIC ERP. Call at us +91-73411-41176 / +91-73411-41175 or send us an email at sales@logicerp.com to book a free demo today!
Yes. Income statement and profit and loss are the same financial statement. Both show revenue, expenses, and net income for a specific period.
Yes. Profit and loss statement and income statement are two names for the same report used to evaluate company’s financial performance.
Yes. Income statement and profit and loss account are the same in practical business accounting, although terminology may vary by country or accounting tradition.
A basic example is:
| Particulars | Amount (₹) |
|---|---|
| Revenue | 10,00,000 |
| Less: Cost of Goods Sold (COGS) | (6,00,000) |
| Gross Profit | 4,00,000 |
| Less: Operating Expenses | (2,50,000) |
| Operating Profit | 1,50,000 |
| Less: Tax | (50,000) |
| Net Profit | 1,00,000 |
You can create it manually in Excel, using a loss statement template, or automatically with LOGIC ERP. For accurate retail reporting, ERP is better because it connects sales, purchases, inventory, expenses, and tax data. Call at us +91-73411-41176 / +91-73411-41175 or send us an email at sales@logicerp.com to book a free demo today!
To do a profit and loss statement, select a reporting period, gather revenue and expense data, calculate net sales, determine cost of goods sold (COGS), compute gross profit, list operating expenses, add other income, subtract non-operating expenses, interest, and taxes, then calculate net income.
You can get a profit and loss statement from your accounting software, ERP system like LOGIC ERP, or financial department. Many trading platforms and brokers also provide P&L statements for investment accounts. Reports can be downloaded in PDF or Excel formats.
Yes, the income statement and profit and loss statement refer to the same financial document. Both show a company’s revenues, expenses, and net income or loss over a period. Terms like profit and loss account, P&L, and income statement are often used interchangeably.
To calculate a common size profit and loss statement, express each line item as a percentage of net sales or total revenue. The formula is: (Line Item / Net Sales) × 100. This helps compare financial performance across periods or companies of different sizes.
Read the P&L statement from top to bottom, starting with revenue, then net sales, COGS, gross profit, operating expenses, operating income, other income, taxes, and net profit. Compare margins and trends over time to assess profitability and cost control.
A profit and loss statement is used to evaluate a company’s financial health, profitability, and operational efficiency. It supports decision-making, budgeting, tax filing, loan applications, investor communication, and performance analysis.
Yes, they are the same. Both terms describe the financial statement that reports revenues, expenses, and net profit or loss for a given period.
Analyze the P&L by reviewing revenue trends, gross profit margin, operating expense ratios, net profit margin, and unusual items. Compare with prior periods and industry benchmarks to identify strengths, weaknesses, and improvement areas.
Cash profit can be estimated by adding back non-cash expenses like depreciation and amortization to net profit. This gives insight into actual cash generated by operations.
Net sales are calculated by subtracting sales returns, discounts, and allowances from gross sales: Net Sales = Gross Sales - Returns - Discounts - Allowances.
Calculate profit and loss by subtracting total expenses (COGS, operating expenses, taxes, interest) from total revenues. The result is net profit if positive or net loss if negative.
Create a P&L in Excel by setting up sections for revenue, COGS, gross profit, operating expenses, other income, taxes, and net profit. Use formulas to sum and subtract amounts, and add comparison or percentage columns for analysis.
Create a P&L in Excel by setting up sections for revenue, COGS, gross profit, operating expenses, other income, taxes, and net profit. Use formulas to sum and subtract amounts, and add comparison or percentage columns for analysis.
Fill out a P&L by entering sales revenue, deducting returns and discounts to get net sales, calculating COGS, subtracting operating expenses, adding other income, subtracting interest and taxes, and determining net profit or loss.
Interpret P&L statements by understanding the relationship between revenue, costs, and expenses, and how they affect profitability. Look for trends, margins, and anomalies to assess business performance.
Make a P&L by selecting a reporting period, collecting income and expense data, organizing it into revenue, COGS, expenses, and income sections, and calculating gross profit and net income.
Use Excel to create a P&L by designing a structured template with rows for revenue, expenses, and profit calculations. Input data and use formulas for totals and subtotals.
Prepare a common size P&L by converting each line item to a percentage of net sales, facilitating comparison across periods or companies.
Make a statement of profit and loss by compiling revenues, deducting expenses, and calculating net profit or loss for a defined period, following standard accounting formats.
Prepare a P&L by gathering financial data, selecting the accounting method (cash or accrual), categorizing income and expenses, and summarizing results in a structured report.
Prepare a common size statement by dividing each expense and income line by net sales and multiplying by 100 to express as a percentage.
Yes, they are the same financial statement with different names.
An example P&L may show: Gross Sales
| Particulars | Amount (₹) |
|---|---|
| Gross Sales | 1,000,000 |
| Less: Returns | (50,000) |
| Net Sales | 950,000 |
| Less: Cost of Goods Sold (COGS) | (600,000) |
| Gross Profit | 350,000 |
| Less: Operating Expenses | (200,000) |
| Net Profit | 150,000 |
A Cash Flow Statement is a financial document that shows the inflows and outflows of cash within a business over a specific period. Unlike the Profit and Loss Statement, which records revenues and expenses based on accounting principles, the Cash Flow Statement focuses solely on actual cash transactions. This helps businesses understand their liquidity and ability to meet short-term obligations.
Cost of Goods Sold (COGS) is calculated by adding the opening stock to purchases and direct expenses related to production, then subtracting the closing stock. The formula is: COGS = Opening Stock + Purchases + Direct Expenses - Closing Stock. This figure represents the direct costs of producing or acquiring the goods sold during the period.
Business Profit is the financial gain a company makes after deducting all expenses from its total revenue. It is reflected in the Profit and Loss Statement as net profit or net income, indicating the company’s profitability during the reporting period.
The Cash Method of accounting records revenue when cash is received and expenses when cash is paid. It is a straightforward approach often used by small businesses or individuals who prefer to track actual cash movement rather than accrued income and expenses.
The Accrual Method records revenues when they are earned and expenses when they are incurred, regardless of cash transactions. This method provides a more accurate picture of a company’s financial performance over time and is commonly used by larger businesses for preparing Profit and Loss Statements.
An Expense Statement is a financial report that details all the costs incurred by a business during a specific period. It is used to track operating expenses, such as rent, salaries, utilities, and marketing, helping businesses monitor spending and control costs to improve profitability.
A company's financial reporting typically includes key documents such as the Profit and Loss Statement (P&L), Balance Sheet, and Cash Flow Statement. These reports provide comprehensive financial information about the company's revenues, expenses, assets, liabilities, and cash movements, enabling stakeholders to assess financial health and performance.
The Profit and Loss Statement is essential because it shows a company’s ability to generate revenue, manage expenses, and realize profits or losses over a specific period. It provides critical insights for decision-making, financial planning, tax compliance, and communicating financial performance to investors, lenders, and management.
Businesses can manage expenses effectively by regularly reviewing their Profit and Loss Statement to identify high-cost areas, optimizing operating expenses such as rent, salaries, and marketing, and implementing cost control measures. Using integrated accounting software like LOGIC ERP helps automate expense tracking and provides real-time financial insights to support better decisions.
In a Profit and Loss Statement, Sales refers to the total revenue generated from selling goods or services, often called "called sales." It represents the top line of the statement and forms the basis for calculating net sales after adjusting for returns, discounts, and allowances.
Income Earned is recorded based on the accounting method used either cash or accrual. Under the accrual method, income is recognized when earned, regardless of cash receipt, and reported in the Profit and Loss Statement as revenue or sales. This financial information helps stakeholders understand the company’s ability to generate earnings during the reporting period.
Tracking Operating Expenses against Revenue helps identify administrative inefficiencies.
To create a profit and loss statement, first choose a reporting period, such as monthly, quarterly, or annually, to provide a financial snapshot during that time.
Operating Expenses (OPEX) are indirect costs like rent, marketing, and salaries.
Positive Net Income indicates a healthy, sustainable business that can reinvest or pay down debt.
Popular Products