The MPS formula is the mathematical backbone of every efficient production schedule. It calculates the Projected Available Balance across each time period — telling manufacturers exactly what to produce, how much to build, and when to start.
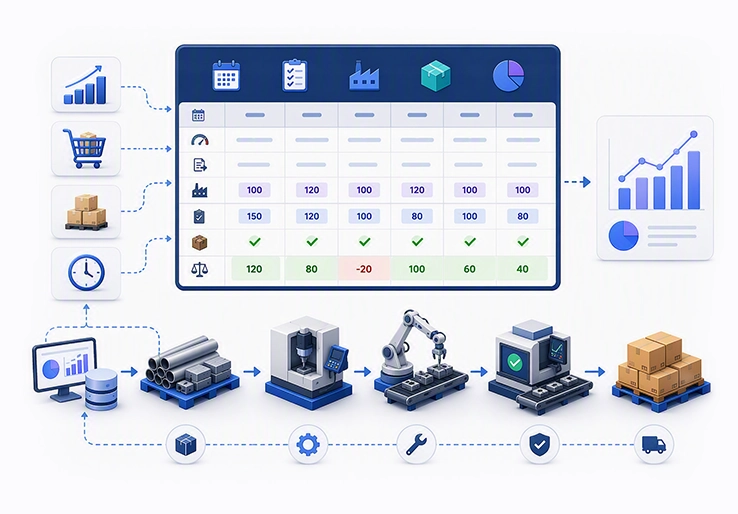
The MPS formula is the mathematical backbone of every efficient production schedule. At its core, it calculates the Projected Available Balance (PAB) across each time period using:
This single calculation tells manufacturers exactly what to produce, how much to build, and when to start — eliminating guesswork from production planning and transforming raw demand data into actionable manufacturing output.
The master production schedule (MPS) formula calculates projected available balance and planned production by time period:
In practice, it determines how much of each finished good to produce and when to produce it by reconciling customer orders, forecasts, starting inventory, scheduled receipts, safety stock, and available capacity.
For production planners, master schedulers, operations managers, supply chain teams, sales stakeholders, ERP administrators, and manufacturing consultants, the MPS formula is the control point between sales demand and shop-floor execution. MPS is the main driver of the MRP process. While material requirements planning focuses on components across all levels of the Bill of Materials, MPS operates at one level of the BOM, concentrating exclusively on finished goods.
A master production schedule helps balance supply and demand in production planning. Without accurate MPS calculations, manufacturers face excess inventory, stockouts, delivery failures, overtime, expediting costs, and uneven resource utilization. Getting the formula right improves inventory cost control, delivery performance, and capacity use while giving production, sales, and procurement a single, reliable plan.
This guide explains what the MPS formula is, why it matters, how its core inputs and calculations work, where common formula variations apply, and how to use examples, software, and implementation practices to build a workable production schedule.
Understanding each variable in the MPS formula is essential before running any calculations. Here's the complete breakdown:
The relationship between MPS and material requirements planning is foundational: MRP calculates material requirements based on the MPS and BOM. Without a reliable master production schedule, MRP generates unreliable component schedules, creating chaos across the entire supply chain.
A master production schedule includes a product list, product variants, and time frames broken into months and weeks. Production quantities are determined based on raw material consumption rates and available production capacity.
Getting from raw data to a finalized production schedule follows three structured steps. No guesswork — just systematic calculation.
Before applying any formula, you need accurate, up to date information:
MPS requires inputs like sales forecasts and current inventory levels. Without these foundations, even the most sophisticated master production scheduling software will produce unreliable results.
With data in hand, calculate the projected available balance for each time period:
When PAB drops below safety stock, trigger a planned order using:
For Available-to-Promise calculations:
Factor in safety stock requirements and lead time offsets to determine when planned order releases must occur — not just when receipts are needed. MPS aligns production with expected demand to prevent overproduction while ensuring customer needs are met.
Raw formula output needs validation before it becomes an executable production schedule:
MPS should be reviewed weekly for accuracy. MPS should be reviewed weekly to remain effective, and MPS requires regular updates based on real-time sales data to keep projections meaningful.
Not every manufacturer uses the same version of the MPS formula. The calculation adapts based on your production strategy and business environment.
Master Production Scheduling (MPS) techniques are essential strategies that manufacturers use to create effective production plans aligned with demand and capacity constraints. Selecting the right technique depends on the nature of the manufacturing environment, product types, and customer requirements. Here are the most common MPS techniques:
Make-to-Stock (MTS)
This technique focuses on producing finished goods based on forecasted demand and stocking them for future customer orders. MTS is ideal for products with stable demand patterns and high volume. The MPS in MTS environments aims to optimize inventory levels, prevent stockouts, and reduce overproduction by aligning production quantities with sales forecasts and safety stock requirements.
Make-to-Order (MTO)
In MTO settings, production is triggered only by actual customer orders rather than forecasts. This approach minimizes finished goods inventory but requires precise scheduling to meet delivery deadlines. The MPS in MTO environments prioritizes order-specific production planning, focusing on raw material availability and lead times to ensure timely fulfillment.
Assemble-to-Order (ATO)
ATO combines elements of MTS and MTO by stocking standard components and subassemblies, which are then assembled into finished products upon receiving customer orders. The MPS technique here involves scheduling production of components based on forecasts while managing final assembly dynamically to meet specific orders.
Batch Production Scheduling
This technique organizes production into groups or batches, optimizing setup times and resource utilization. The MPS defines batch sizes and timing to maximize efficiency while balancing inventory holding costs and demand fulfillment.
Mass Customization
Mass customization blends high-volume production with customization flexibility. The MPS schedules the production of generic base products in advance, allowing customization processes to be completed later based on customer specifications. This technique requires careful coordination between standard production and customization workflows.
Each MPS technique incorporates critical factors such as available resources, lead times, batch sizes, and safety stock levels to ensure the production schedule is both feasible and responsive to market demands. Implementing the appropriate MPS technique enables manufacturers to balance supply and demand effectively, optimize inventory, and improve overall operational efficiency.
Abstract formulas become meaningful only when applied to actual manufacturing operations. Here are three scenarios demonstrating how MPS calculations drive real decisions.
A manufacturer begins with 5,000 units on hand. The sales forecast predicts demand of 10,000 units over the next 4 weeks. Safety stock is set at 1,000 units. Component lead time is 2 weeks.
| Week | Forecast | Customer Orders | Net Demand | Scheduled Receipts | MPS Planned | PAB | ATP |
|---|---|---|---|---|---|---|---|
| 1 | 2,500 | 3,000 | 3,000 | 0 | 0 | 2,000 | - |
| 2 | 2,500 | 1,800 | 2,500 | 2,000 | 2,000 | 3,500 | 2,200 |
| 3 | 2,500 | 500 | 2,500 | 0 | 2,000 | 3,000 | 1,500 |
| 4 | 2,500 | 200 | 2,500 | 0 | 2,000 | 2,500 | 1,800 |
In week 1, net demand uses actual customer orders (3,000 > forecast 2,500). PAB drops to 2,000 — above safety stock, so no emergency order is triggered. Starting week 2, planned orders of 2,000 units (lot size constraint) maintain PAB above the 1,000-unit safety stock floor. These results drive procurement decisions: raw materials must be ordered in week 0 to meet the 2-week lead time.
An alternator manufacturer faces forecast demand of 500/month January through March, then 1,500 in April (seasonal peak). On-hand inventory is 600 units. Safety stock is 200 units. Lead time is two months. Batch size is 400 units.
The MPS formula reveals that production must ramp in February and March — scheduling 1,200 units (3 batches × 400) in each month — to build sufficient inventory before April's demand spike. Without the formula, the manufacturing department would face a capacity crisis in April, resulting in missed deliveries and overtime costs.
Pharmaceutical manufacturing adds regulatory constraints to the formula. Batch yields are governed by fixed recipe specifications, quality hold times (where inventory isn't available until inspection clears), and changeover requirements between products. Safety stock is often stricter due to regulatory risk — a stockout of a critical medication carries consequences beyond lost revenue.
The MPS formula must account for these additional lead time components, effectively extending the production cycle and requiring earlier planned order releases than standard manufacturing.
The MPS formula serves multiple roles across manufacturing operations and operations management:
Manual MPS calculations using spreadsheets are where most manufacturers start — and where many get stuck. Spreadsheets are static, error-prone, and incapable of enforcing batch sizing rules, capturing real-time changes in firm orders or capacity shifts, or handling the complexity of multi-product, multi-period planning. As production activities scale, spreadsheet-based MPS becomes a liability.
Modern master production scheduling software within ERP systems eliminates these limitations. Using ERP software automates MPS adjustments in real-time. Here's what capable production ERP management software delivers:
Master Production Scheduling (MPS) software is designed to streamline and optimize manufacturing planning by automating complex scheduling calculations and integrating real-time data across departments. Key features include:
Implementing MPS software delivers significant advantages that enhance manufacturing performance and competitiveness:
By leveraging advanced MPS software, manufacturers can transform production planning from a reactive, error-prone process into a strategic capability that drives operational excellence and sustainable growth.
LOGIC ERP's MPS module automates the entire formula execution cycle. It handles projected available balance calculations, ATP generation, scheduled receipts, planned order releases, lot sizing, safety stock thresholds, and time fence management — all within a unified manufacturing ERP system that connects to demand planning, stock management, procurement, and production floor execution.
Cloud solutions offer greater agility, easier updates, scalability, and cross-location collaboration. On-premise deployments may provide tighter security and local customization. The key trade-offs involve data latency, total cost of ownership, and upgrade responsibility. Either way, the goal is the same: replace reactive firefighting with advanced planning powered by accurate, automated MPS formula calculations.
A properly implemented MPS formula transforms your production planning process from reactive chaos into structured, predictable manufacturing operations. Here's how to get started:
Select 5–10 high-volume SKUs and build the complete MPS grid: demand forecasts, safety stock, lot sizes, lead times, and time fences. Validate formula outputs against historical data before scaling.
MPS requires accurate demand forecasts for effective production planning. Audit inventory levels, BOM accuracy, lead time records, and customer order pipelines. Bad data produces bad schedules — no formula can overcome garbage inputs.
Establish frozen, slushy, and liquid zones that reflect your actual production cycle flexibility. Over-rigid frozen zones reduce your ability to respond to urgent orders; overly loose zones create instability on the production floor.
A master production schedule outlines what products to manufacture, when, and in what quantities. The right manufacturing ERP system automates these calculations, integrates with your existing inventory management and demand planning systems, and provides the real-time visibility needed for informed decision-making.
MPS facilitates coordination between production, sales, and procurement. Connect your MPS outputs to procurement scheduling, sales ATP visibility, and capacity planning dashboards so every stakeholder operates from one version of truth.
Review forecast accuracy monthly. Refine safety stock calculations quarterly. Analyze MPS performance metrics — schedule adherence, inventory turns, service levels — and adjust parameters accordingly.
Master Production Schedule (MPS) formulas are the cornerstone of effective production planning and inventory control in manufacturing. By accurately calculating projected available balances and aligning production with real demand, MPS helps manufacturers avoid costly stockouts, reduce excess inventory, and optimize the use of production resources. Integrating safety stock, lead times, and batch size constraints into the formula ensures a realistic and actionable schedule that supports timely order fulfillment and operational efficiency.
Leveraging modern ERP systems to automate MPS calculations transforms planning from a manual, error-prone task into a dynamic, real-time process. This integration enhances collaboration across sales, production, and procurement teams, providing a single source of truth that drives better decision-making and responsiveness to market changes.
Ultimately, mastering the MPS formula empowers manufacturers to balance supply and demand effectively, improve delivery performance, and maintain optimal inventory levels — key factors in achieving competitive advantage and sustainable growth in today's complex manufacturing environment.
Call at +91-73411-41176 / +91-73411-41175 or send us an email at sales@logicerp.com to book a free demo today!
The fundamental equation is the Projected Available Balance formula:
Net demand equals either confirmed customer orders (inside the demand fence) or the greater of forecast/customer orders (outside the fence). When PAB drops below safety stock, the system triggers a planned order:
It's worth noting the acronym "MPS" also appears in economics, where the Marginal Propensity to Save (MPS) measures the proportion of additional income that is saved. MPS is calculated using the formula MPS = ΔS/ΔY, where ΔS represents the change in savings and ΔY represents the change in disposable income. MPS typically ranges between 0 and 1, and the sum of MPS and the Marginal Propensity to Consume (MPC) equals 1. A higher MPS reduces the Keynesian multiplier effect, and MPS is generally higher for higher-income individuals. MPS is used to gauge the potential impact of fiscal policies, influences economic forecasting and consumer behavior predictions, and changes in national income affect total national savings based on MPS. In this guide, we focus exclusively on the manufacturing Master Production Schedule meaning.
MPS should be reviewed weekly for accuracy. Many companies recalculate daily in volatile environments. The planning horizon typically spans 3 months to 2 years ahead, depending on lead time length and demand stability. Inside demand fences (the next 1–2 weeks), changes are nearly frozen to protect the production floor from constant disruption. Further-out periods remain flexible for adjustments. Real-time recalculation capability within ERP systems is a significant differentiator — it ensures the production planning process always reflects current reality rather than stale historical data.
MPS helps maintain optimal inventory levels and reduces costs. It improves customer service by enabling accurate delivery commitments. And it provides the structured framework that separates world-class manufacturers from those perpetually fighting fires.
Ready to automate your MPS formula calculations? LOGIC ERP's production planning module handles PAB, ATP, planned orders, capacity constraints, and scenario analysis — giving your planning team the tools to optimize inventory levels, meet customer demand, and scale manufacturing output with confidence.
Yes. The formula addresses variability through multiple mechanisms: safety stock buffers sized to service level targets, proper selection of net demand (forecast vs. actual demand), lot sizing rules that build buffer into production quantities, and scenario planning capabilities. Statistical safety stock methods — using standard deviation of demand × √lead time × z-value — are especially valuable in industries like consumer electronics and FMCG where forecast accuracy is inherently limited. Demand sensing techniques can also improve the forecast inputs that feed the MPS formula.
When planned production volumes surpass available manufacturing capacity, planners must resolve the conflict using rough cut capacity planning. Options include: smoothing production by shifting volumes to earlier or later periods, authorizing overtime or subcontracting, splitting batches across shifts, adjusting lot sizes, or negotiating revised delivery dates with customers. Modern ERP and APS tools visualize capacity loading against capacity requirements, enabling planners to make informed trade-offs between delivery performance and reducing costs — before committing to the schedule.
Inventory Management involves overseeing and controlling raw materials, work-in-progress, and finished goods to ensure optimal stock levels. Effective inventory management reduces holding costs, prevents stockouts, and supports smooth production workflows.
Demand Planning forecasts customer demand using historical data and market trends. Accurate demand planning enables the MPS to align production quantities with expected sales, reducing overproduction and ensuring timely order fulfillment.
Inventory Optimization balances stock levels to minimize costs while meeting customer demand. Techniques include safety stock calculation, just-in-time replenishment, and integrating inventory data with production schedules through ERP systems.
A Manufacturing ERP System integrates data across departments, automating MPS calculations, inventory tracking, procurement, and capacity planning. This integration enhances visibility, reduces errors, and improves decision-making in production management.
The manufacturing process defines the sequence of operations, lead times, and resource requirements. Incorporating process details into the MPS ensures realistic scheduling that respects production constraints and maximizes efficiency.
Advanced Planning involves using sophisticated tools and algorithms to optimize production schedules, capacity utilization, and supply chain coordination. It often includes scenario analysis and real-time adjustments to respond to changing conditions.
Inventory Costs include storage, handling, and capital costs tied up in stock. Managing these costs through accurate MPS and inventory control helps manufacturers reduce waste and improve profitability.
Inventory Control monitors stock levels, movements, and accuracy to prevent shortages or excesses. It is maintained through regular audits, real-time tracking, and integration with production and procurement systems.
Alternate Schedules are contingency production plans created to address unexpected changes such as demand spikes, supply delays, or capacity constraints. They enable manufacturers to adapt quickly and maintain service levels.
A detailed plan outlines specific production activities, timelines, resource allocations, and quantities required to meet manufacturing goals. It provides a clear roadmap to execute the master production schedule effectively.
Popular Products