Learn what On Time In Full (OTIF) means, how to calculate the OTIF formula, why it matters for supply chain success, common causes of poor OTIF, and effective strategies to improve your delivery performance and customer satisfaction.
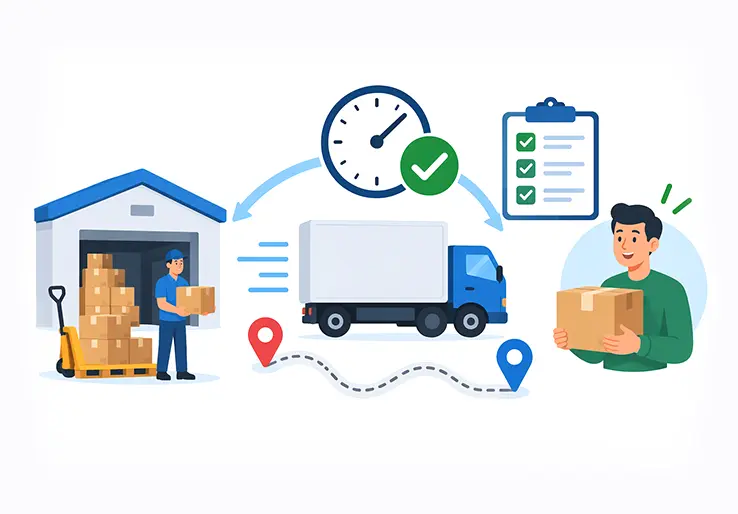
Every missed delivery and every incomplete order chips away at customer trust and your bottom line. On Time In Full (OTIF) is a key supply chain KPI that measures whether customer orders are delivered by the promised date and in the complete quantity ordered, combining delivery timeliness and order completeness in a single number.
For supply chain professionals, logistics managers, procurement teams, warehouse operators, and business decision-makers, OTIF is one of the clearest ways to judge fulfillment performance, reduce stockouts and avoid the extra costs caused by delays, split shipments, and order errors. This guide explains what OTIF means, how to calculate it, what a good OTIF percentage looks like, why OTIF scores fall, how OTIF differs across industries, and the practical steps and LOGIC ERP capabilities that help improve it consistently.
On Time In Full (OTIF) is a critical key performance indicator in supply chain management that measures whether customer orders arrive by the promised date and contain the complete quantity ordered. It directly affects customer satisfaction, inventory costs, and overall supply chain efficiency, making it one of the most important fulfillment metrics any business can track.
On Time In Full (OTIF) is a supply chain KPI that measures whether an order is delivered by the promised date and with the complete quantity ordered.
OTIF is a combined delivery reliability metric used across modern supply chains in retail, FMCG, distribution, e-commerce, and manufacturing. It measures a company’s order fulfillment ability by evaluating whether each order meets two conditions simultaneously: delivered on or before the promised delivery window and delivered in the full, correct quantity to the right location.
If an order is early but incomplete, or complete but late, it does not qualify as OTIF under a strict definition. Both conditions must be satisfied for a single order to count as compliant. This makes OTIF stricter than tracking on time delivery or fill rate in isolation.
OTIF originated in 2017 when Walmart began evaluating suppliers against specific delivery compliance thresholds, and the practice quickly spread across major retailers and distributors worldwide. Today, OTIF is widely used in supplier scorecards, retailer compliance programs, and logistics contracts to enforce service-level agreements.
LOGIC ERP customers use OTIF as a central KPI for evaluating both their own outbound performance to customers and supplier inbound reliability on purchase orders.
The acronym breaks down into two distinct components: "On Time" measures whether the delivery arrived within the agreed delivery window, and "In Full" measures whether the ordered quantities and product lines were complete. Together, OTIF integrates delivery timing, order completeness, and basic delivery accuracy into a single number. It is both a measure of customer service and operational efficiency.
In practical terms, OTIF measures:
OTIF is typically tracked at order level (the entire order must pass both tests) but can also be measured at line level or case level depending on industry and retailer requirements. Different interpretations of "on time" complicate OTIF measurement, which is why the metric is almost always calculated from the customer’s perspective, not the shipper’s convenience. The customer’s receiving timestamp is what matters.
Consistent OTIF measurement requires a clear, documented internal definition, what the Cardiff University OTIF study calls a standard OTIF definition, shared with suppliers, logistics service providers, and internal teams.
OTIF performance directly ties to customer satisfaction, revenue protection, and supply chain efficiency across sourcing, production, warehousing, and last-mile delivery. When OTIF is high, predictable deliveries prevent disruptions in manufacturing and retail stock management. When it drops, the consequences cascade.
High OTIF reduces stockouts, emergency shipments, and rework. Low OTIF leads to penalties, lost sales, and erosion of trust. High OTIF performance ensures customer satisfaction and brand loyalty because customers receive what they ordered, when they expected it.
OTIF provides a data-backed metric to evaluate vendor performance. It is used in supplier scorecards and retailer compliance programs where failure to meet agreed OTIF targets can trigger fines, chargebacks, or formal non-conformance reports, making regulatory compliance a real concern. High OTIF rates support supplier management by comparing suppliers’ performance against consistent, objective criteria.
Organizations with strong OTIF typically have better demand planning, real time visibility into inventory, and stronger cross-functional collaboration, all hallmarks of proactive management.
Many companies start by tracking separate KPIs, on-time delivery and fill rate (in-full), and later adopt OTIF to get a combined, more accurate view. Here is how they differ:
| Metric | What It Measures | Key Question | Typical Use Case |
|---|---|---|---|
| On Time | Delivery timing only | Was it delivered when promised? | Carrier performance tracking |
| In Full | Order completeness only | Was the complete quantity delivered? | Inventory and warehouse accuracy |
| OTIF | Both timing and completeness | Was the complete order delivered on time? | Overall fulfillment and supplier scorecards |
Because OTIF combines on-time delivery and in full delivery rates, a company can have 98% on-time delivery and 95% in-full delivery yet still see OTIF below 94%, since only orders passing both tests count.
A typical order journey looks like this: a customer places an order, the seller confirms a promise date, the warehouse picks and packs the items, a carrier dispatches the shipment, and the customer receives and checks in the goods. OTIF evaluation happens at the end of this chain.
An order qualifies as OTIF when it is delivered within the promised time window, contains complete quantities, includes the correct SKUs, and is successfully received by the customer. If any element fails, it is not OTIF-compliant.
One important nuance: OTIF scores do not indicate responsibility for delivery failures. A failed OTIF order might be caused by a supplier delay, a warehouse error, a carrier issue, or even a customer receiving a dock problem. Similarly, OTIF does not account for the duration of delivery delays; whether an order is one hour late or one week late, both count equally as a failure.
Companies must also decide which timestamp defines "on time": departure scan, arrival at gate, unloading completion, or customer system receipt. Promised versus requested versus scheduled dates can differ, and picking one reference date standard is essential for consistent measurement.
LOGIC ERP stores and compares promised and actual delivery dates at both order and line levels, automating the OTIF qualification logic and removing subjective interpretation.
Here is the core OTIF formula:
OTIF % = (Number of Orders Delivered On Time and In Full ÷ Total Number of Orders) × 100
The numerator must include only those orders that simultaneously meet both the on-time and in-full conditions according to the company’s defined rules. OTIF is calculated as (on-time and complete deliveries ÷ total deliveries) × 100.
OTIF can be calculated for a specific period (month, quarter), a customer segment, a warehouse, a product family, or a specific supplier, depending on analysis needs.
Some organizations compute OTIF by multiplying separate on-time and in-full rates (e.g., 95% OT × 96% IF = 91.2% OTIF). While this variant exists, most companies prefer the straightforward order-based formula because it directly reflects the customer’s perspective: either the entire order was perfect or it was not.
Consistent data sources, drawn from your ERP, WMS, and TMS, are critical for accurate OTIF calculation.
Follow these steps to calculate OTIF for any period or segment:
Define Your OTIF Rules
Specify what "on time" means (e.g., within ±1 day of promised date), what "in full" means (100% of ordered quantity, correct items), and which timestamp to use.
Collect Order and Delivery Data
Pull order records with promised dates, actual delivery dates, ordered quantities, and delivered quantities from your order management system.
Flag OTIF-Compliant Orders
Mark each order that satisfies both the on-time and in-full conditions.
Count Compliant vs Total Orders
Tally OTIF-compliant orders against total orders shipped.
Compute the OTIF %:
Apply the formula.
Outbound example
A distributor processes 500 customer orders in June. Of these, 450 are delivered on time and in full. OTIF = (450 ÷ 500) × 100 = 90%.
Inbound example
Your procurement team places 200 purchase orders with suppliers in Q2. Of these, 160 arrive on time and in full. Inbound supplier OTIF = (160 ÷ 200) × 100 = 80%.
A score of 90% indicates 108 out of 120 deliveries were on time and complete, when applied to a smaller sample. The math scales identically regardless of volume.
To calculate OTIF for multiple products, you can segment by product group. For instance, A-class SKUs might show 97% OTIF while C-class long-tail items drag the average down to 88%, revealing hidden problems that a blended number would mask.
Order-level OTIF means an order counts as a success only if every single line within it is delivered on time and in full. Line-level OTIF evaluates each order line separately, giving credit for partial successes.
Example: A purchase order has 5 product lines. Four lines arrive on time and complete, but one line is missing 50 units. At order level, OTIF = 0% (the entire order failed). At line level, OTIF = 80% (4 out of 5 lines passed).
Businesses with large, complex, multi-SKU orders often prefer line-level OTIF because one missing line should not mask strong performance across the rest. Conversely, order-level OTIF is ideal for retailer scorecards, B2B SLAs, or high-stakes deliveries where a single missing item disrupts operations.
Measuring OTIF can highlight weaknesses in warehouse packing and inventory counts that would otherwise go unnoticed in aggregate metrics. LOGIC ERP supports both views in reporting dashboards, letting managers switch between order-level and line-level OTIF for analysis.
Example 1: Successful OTIF Delivery
A retailer orders:
Promised delivery: 10 March 2026. The supplier delivers all 1,000 units on 10 March to the correct distribution center.
Result: OTIF = Yes. Both conditions (on time and in full) are satisfied.
Example 2: Failed OTIF Delivery
Same order, but 100 units of Product B arrive on 12 March instead of 10 March, while Products A and C arrive on time and complete.
Result:
Even though most of the order was delivered correctly, the late or incomplete deliveries mean the entire order fails under strict order-level measurement.
Example 3: Partial Shipment
A manufacturer ships 70% of an order on time. The remaining 30% is back-ordered and arrives five days late.
Under most OTIF rules, this order counts as a failure at order level because the in full delivery condition was not met on the promised date. Some companies measure line-level or quantity-weighted OTIF to capture the 70% that did arrive correctly, but strict definitions do not give partial credit.
Strong OTIF performance translates directly into increased customer satisfaction, higher revenue retention, and improved supply chain stability. When orders consistently arrive on time and complete, customer demand is met without friction.
High OTIF rates enhance customer satisfaction and loyalty. Conversely, late or incomplete deliveries force customers to find alternative suppliers, leading to lost sales and long-term revenue erosion. Companies with high OTIF gain a competitive edge over rivals who cannot deliver reliably.
Improved OTIF reduces inventory holding costs significantly. When deliveries are predictable, businesses can operate lean inventory models with lower safety stock buffers instead of over-stocking to compensate for unreliable fulfillment. High OTIF performance also leads to reduced operational costs by eliminating rush orders, expedited freight, and correction shipments.
OTIF helps track supplier performance objectively, enabling data-driven negotiations, better contracts, and structured supplier development programs. Financially, strong OTIF means fewer retailer chargebacks, lower expedited freight charges, and more efficient warehouse scheduling thanks to predictable delivery processes.
Improving OTIF is not just about avoiding fines. It directly enhances competitiveness and operational resilience across the entire supply chain.
Low OTIF usually results from multiple overlapping factors across planning, inventory, warehouse operations, transportation, and external influences. Rarely is a single root cause responsible. OTIF scores below 85% indicate poor service levels that demand immediate attention.
Internal causes:
Logistics-related causes:
External factors:
Data consolidation for OTIF calculation is often challenging, especially when companies run disconnected ERP, WMS, and TMS systems with conflicting data. Achieving 100% OTIF is often unrealistic due to external factors, but understanding root causes by segment (customer, route, product family, supplier) is essential. A declining OTIF rate can indicate problems in forecasting or supplier performance that need targeted investigation, not just blanket corrective actions.
Improving OTIF requires proactive management and cross-functional collaboration. Sales, planning, procurement, production, warehouse, and logistics teams must share a common OTIF target and work from the same data.
Improving demand forecasting reduces the risk of stockouts and excess inventory. Use historical sales data, incorporate seasonality and promotional calendars, and apply demand planning tools to improve forecast accuracy. Better forecasts mean you stock the right products in the right quantities.
Maintaining buffer stock for critical items helps to mitigate stockout risks without creating excessive overstock. Apply ABC classification to prioritize material availability for high-velocity SKUs, and ensure real time visibility across all inventory locations.
Validate orders at entry: confirm stock availability, check delivery feasibility, and verify customer expectations before committing a promise date. Automated workflows reduce picking and packing errors that cause in-full failures.
Effective communication with suppliers can optimize OTIF scores. Share scorecards, define inbound OTIF targets, and engage with suppliers and logistics providers to enhance OTIF performance. Use OTIF data to identify underperforming vendors and collaborate on improvement plans.
Using advanced inventory visibility and route planning can improve OTIF metrics. Select carriers based on reliability data, consolidate shipments where possible, and manage delivery window commitments realistically.
Real-time tracking of shipments allows proactive intervention for potential delays before they become OTIF failures. Implement weekly root-cause reviews of all non-OTIF orders, categorizing failures by source: forecasting, inventory, production, warehouse, transport, or external factors. Use this analysis to design targeted corrective actions rather than reacting to the overall score.
Integrated ERP platforms are essential to improve OTIF because they connect orders, inventory, production, warehouse operations, and delivery data in real time. Without a single source of truth, teams work from conflicting data, and OTIF suffers.
LOGIC ERP provides real-time inventory visibility across warehouses and stores, enabling accurate Available-to-Promise (ATP) checks during order entry. This prevents teams from committing delivery promises they cannot keep.
Automated order processing in LOGIC ERP validates quantities, pricing, delivery dates, and credit limits, eliminating last-minute order holds that hurt OTIF delivery performance. The warehouse management capabilities support guided picking, barcode scanning, batch and serial tracking, and packing workflows that reduce errors affecting full delivery accuracy.
Real-time visibility can improve OTIF performance by 10%, according to industry benchmarks. LOGIC ERP supports this through a connected workflow:
Order Received → Inventory Check → Allocation → Picking → Packing → Dispatch → Delivery Confirmation → OTIF Measurement
Each step can be monitored with alerts when OTIF risk is detected, whether due to insufficient stock, tight lead times, or carrier delays.
An OTIF dashboard gives managers a daily and monthly view of fulfillment health, combining OTIF with supporting logistics KPIs that help diagnose problems before they escalate.
| KPI | What It Shows |
|---|---|
| OTIF % | Overall fulfillment performance (timing + completeness) |
| On-Time % | Delivery punctuality independent of completeness |
| In-Full % | Order completeness independent of timing |
| Fill Rate | Percentage of demand fulfilled from available stock |
| Order Cycle Time | Average time from order placement to delivery |
| Stockout Rate | Frequency of unavailable inventory events |
| Perfect Order Rate | Order execution quality including damage-free and correct documentation |
Segment these KPIs by customer, region, warehouse, carrier, and supplier to pinpoint where OTIF performance is strong or weak. Business intelligence tools integrated with your ERP make this segmentation straightforward.
Use trend charts (OTIF over the last 12 months) and exception views (orders that failed OTIF with categorized reasons) to drive targeted improvements rather than reacting to aggregate numbers.
OTIF must be read alongside other supply chain metrics to avoid misleading conclusions. A high OTIF score achieved through massive safety stock buffers, for example, might indicate poor supply chain efficiency even though delivery performance looks strong.
OTIF vs On-Time Delivery: On-time delivery only checks punctuality. A company might show 98% on time delivery but only 90% OTIF because 8% of deliveries arrived punctually but with incomplete quantities.
OTIF vs Fill Rate: Fill rate measures quantity availability from stock at the point of order. OTIF covers the whole end-to-end process from order through delivery, capturing transportation and warehouse failures that fill rate misses.
OTIF vs Perfect Order Rate: The perfect order rate includes additional dimensions beyond OTIF, such as damage-free delivery and correct documentation. It is broader than OTIF and typically produces lower scores.
OTIF vs Order Cycle Time: Cycle time measures speed from order to delivery. OTIF measures reliability within agreed customer expectations. A short cycle time does not guarantee high OTIF if commitments are still missed. Together, these other logistics KPIs provide a complete picture of supply chain operations.
There is no universal benchmark. A good OTIF benchmark depends on industry, product type, customer expectations, and network complexity. Companies should set realistic OTIF targets based on historical data and customer commitments rather than simply copying external numbers.
Typical ranges from industry benchmarking data:
| Industry | Good OTIF | Excellent OTIF |
|---|---|---|
| Retail / FMCG | 90–95% | 95–97% |
| E-commerce / DTC | 88–94% | 95–98% |
| Wholesale / B2B | 88–94% | 94–97% |
| Industrial / Automotive | 95–98% | 99%+ |
| Warehousing (median) | ~95% | 97%+ |
A good OTIF score is typically 95% or higher. OTIF scores of 95% or higher indicate a resilient supply chain capable of meeting customer expectations consistently. Walmart’s OTIF target increased from 75% to 98% since 2017, with Walmart improving OTIF from 75% to 87% by 2019 as a milestone along the way.
Track separate OTIF targets for strategic customers, priority SKUs, or regulated products where low OTIF scores carry higher penalties or compliance risk.
OTIF expectations and practical challenges vary substantially between industries. Understanding these differences helps you set realistic OTIF goals and design industry-appropriate improvement strategies.
Strict delivery windows to distribution centers or stores, high penalty risk for non-compliance, and strong focus on promotional and seasonal peaks define retail supply chains. Retailers increasingly use OTIF in vendor scorecards with chargebacks for violations.
Inbound OTIF is critical to avoid line stoppages. A missing component can halt an entire production run. Outbound OTIF impacts B2B customer operations and contractual SLAs, where consistent delivery enables streamlining supply chains for both parties.
Shorter delivery promises (same-day, next-day), higher order volumes with small baskets, and the direct impact on online ratings and customer satisfaction make e-commerce OTIF uniquely challenging. Split shipments and parcel carrier variability add complexity.
Emphasis on recurring schedules, framework contracts, and long-term relationships. Consistent OTIF strengthens trust, reduces the need for buffer inventory at customer sites, and supports stable supply chain partnerships.
Struggling with delayed deliveries, incomplete orders, or poor inventory visibility? These problems directly erode customer satisfaction, increase operational costs, and weaken your competitive edge across the entire supply chain.
LOGIC ERP integrates sales orders, purchase orders, inventory, warehouse, and logistics data to provide a single version of truth for OTIF performance. With configurable OTIF definitions, automated OTIF calculation, drill-down reports by customer or supplier, and threshold-based alerts, your team moves from reactive firefighting to streamline processes that prevent failures before they happen.
LOGIC ERP supports proactive management: planners can see future risk orders, identify insufficient stock or tight lead times, and act before OTIF failures occur. The result is fewer penalties, better delivery accuracy, and stronger customer relationships built on complete deliveries in a timely manner.
On Time In Full (OTIF) is a vital supply chain performance metric that combines delivery timeliness and order completeness into a single, actionable KPI. Achieving a high OTIF score is essential for maintaining customer satisfaction, reducing operational costs, and enhancing overall supply chain efficiency. While reaching 100% OTIF is often unrealistic due to external and internal factors, aiming for 95% or higher sets a strong benchmark for resilience and reliability.
Improving OTIF requires coordinated efforts across demand forecasting, inventory management, warehouse operations, supplier collaboration, and transportation planning. Integrated ERP systems like LOGIC ERP play a crucial role by providing real-time visibility, automating order and inventory processes, and enabling proactive management of potential delivery risks.
By consistently measuring, analyzing, and acting on OTIF data, businesses can identify root causes of failures, optimize supply chain processes, and build stronger relationships with customers and suppliers. Ultimately, OTIF is more than just a metric; it is a cornerstone of operational excellence and a key driver of competitive advantage in today’s fast-paced market environment.
Call at +91-73411-41176 / +91-73411-41175 or send us an email at sales@logicerp.com to book a free demo today!
Most companies track OTIF daily or weekly for operational visibility, allowing teams to catch and address delivery failures quickly. Monthly reviews help identify trends, while quarterly or annual reviews inform strategic decisions. Weekly root-cause reviews of OTIF failures are a best practice, as seen in companies that improved from 62% to 76% OTIF through regular S&OE routines.
Many retailers treat early deliveries as non-compliant because they disrupt dock capacity, shelf-space plans, and inventory flow at distribution centers. Whether early counts as "on time" depends entirely on your company’s OTIF definition. Define this rule explicitly and communicate it to all logistics providers and internal teams.
Backordered quantities almost always prevent an order from counting as OTIF because the in full delivery rate condition is not met. Split shipments complicate measurement: if both parts arrive within the delivery window and together constitute the full order, some companies count it as OTIF. Under strict order-level rules, however, split shipments typically fail because the complete deliveries requirement is not satisfied in a single receipt.
Yes. Inbound OTIF measures a supplier’s ability to deliver purchase orders on time and complete to your facilities. Outbound OTIF measures your own service level to customers. These typically have different targets because you have less control over inbound flows. Many companies target 80–90% inbound OTIF initially, improving toward 95% through supplier development.
Initial gains from data cleanup, process standardization, and better inventory control techniques can appear within 3–6 months. Reaching stable high performance in the mid-to-high 90s often takes 12–18 months, depending on process maturity, technology adoption, product complexity, and market demands. Continuous improvement and governance are key to sustaining gains.
Logistics companies are essential for achieving high OTIF by ensuring timely and complete deliveries. They optimize transportation routes, coordinate schedules, and provide real-time shipment tracking, which helps reduce delays and errors. Their expertise enhances supply chain efficiency and directly impacts customer satisfaction.
Efficient logistics operations streamline the entire delivery process from order receipt to final delivery. They manage inventory handling, packing, and transportation scheduling, ensuring orders are fulfilled on time and in full. Poor logistics operations can cause delays and incomplete shipments, lowering OTIF scores.
Key logistics processes include accurate order picking, packing, shipment scheduling, and carrier selection. Automation and technology integration in these processes reduce errors and improve delivery accuracy, helping maintain high OTIF performance.
OTIF on time measurement identifies delays and inefficiencies in the supply chain. It provides critical data for improving scheduling, supplier management, and transportation planning, which enhances overall supply chain reliability and customer satisfaction.
Customer satisfaction depends on receiving orders complete and on time, which OTIF measures directly. High OTIF rates minimize errors and delays, leading to improved customer trust, loyalty, and repeat business.
Supply chain efficiency is demonstrated by high OTIF scores, indicating that orders are delivered accurately and punctually. Efficient collaboration among all supply chain partners reduces costs and improves operational performance.
External factors like weather conditions, political instability, customs delays, and pandemics can disrupt deliveries and affect OTIF. Companies must implement risk management strategies to mitigate these impacts.
Proactive management uses real-time monitoring and analytics to detect potential delays early. This enables timely corrective actions, such as rerouting or inventory adjustments, to maintain high OTIF levels.
Regulatory compliance prevents shipment delays and penalties by ensuring adherence to legal and industry standards. Compliance supports smooth delivery operations, protecting OTIF performance and customer satisfaction.
Popular Products