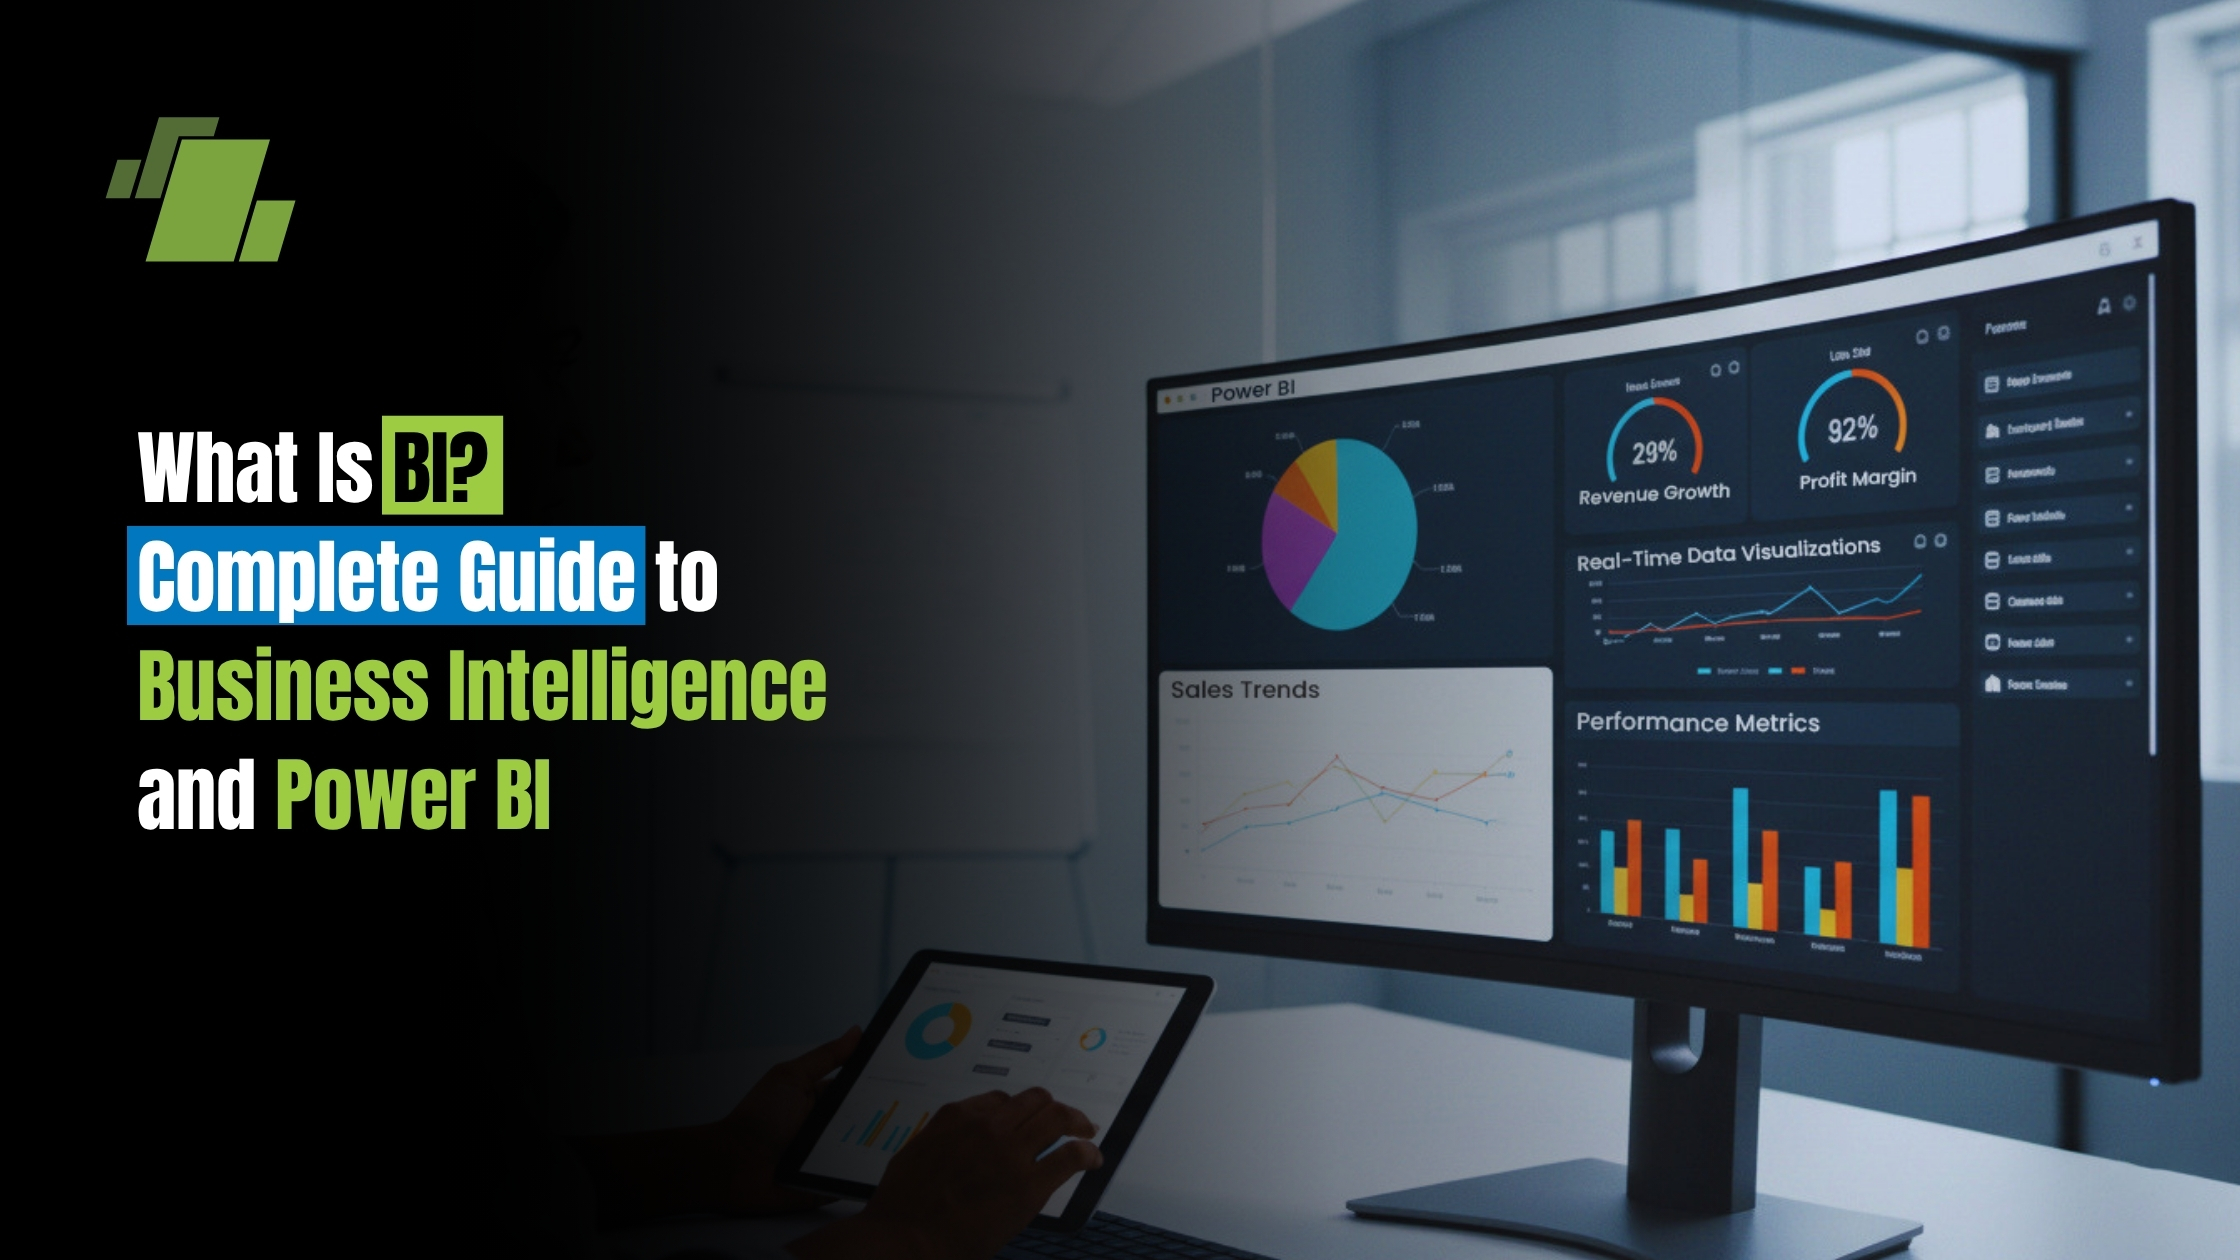
What Is BI? Complete Guide to Business Intelligence and Power BI

Summary
Business Intelligence (BI) is the technology-driven process of collecting, integrating, analyzing, and visualizing business data to support informed decision-making. This guide covers the evolution of BI, key concepts, types of BI, and the role of Microsoft Power BI as a leading BI platform. Understand how BI tools empower business users and data experts to gain actionable insights, monitor key performance indicators, and improve operational efficiency.
Introduction
This comprehensive guide is designed for business users, analysts, executives, and IT professionals who want to understand the fundamentals and practical applications of Business Intelligence (BI) and Microsoft Power BI. Whether you are new to BI or seeking to deepen your expertise, this guide covers everything from the core concepts and evolution of BI to the advanced features of Power BI and its integration with enterprise systems like LOGIC ERP.
Understanding BI and Power BI is crucial for modern organizations aiming to become data-driven. With the exponential growth of business data, organizations need effective tools and processes to collect, manage, and analyze information. BI empowers decision-makers at all levels to transform raw data into actionable insights, optimize operations, and gain a competitive edge in today’s fast-paced business environment.
Key Takeaways
- Business Intelligence (BI) transforms raw data from multiple data sources into meaningful insights through data integration, data visualization, and reporting.
- Modern BI prioritizes self-service BI, enabling business users to create interactive dashboards and reports without heavy IT involvement.
- Microsoft Power BI is a powerful BI platform that supports data modeling, transformation, and AI-powered analytics to enhance data-driven decisions.
- BI helps organizations identify market trends, optimize business operations, and gain competitive advantage by leveraging historical data and predictive analytics.
- Implementing BI cultivates a data-driven culture, improving decision-making across all organizational levels with timely, relevant data insights.
What Is Business Intelligence (BI)?
Business intelligence (BI) is a set of technological processes for collecting, managing, and analyzing organizational data to yield insights that inform business strategies and operations. BI is descriptive, focusing on analyzing past and current data to paint a picture of the current state of the business and support informed decision-making. By leveraging BI, organizations can better understand what has happened and what is happening now, enabling them to make more effective business decisions.
Definition of BI
Business intelligence (BI) is a set of technological processes for collecting, managing, and analyzing organizational data to yield insights that inform business strategies and operations. BI is fundamentally descriptive, focusing on what happened in the past and what is happening now. It is primarily concerned with analyzing past and current data to provide a clear understanding of business performance.
Modern business intelligence encompasses the entire analysis process from data collection and data integration to data visualization and reporting. BI is fundamentally descriptive analytics, focusing on understanding “what has happened” and “what is happening” within your business operations.
Key Components of BI
A typical BI system includes three main parts:
- Data integration: Gathers data from various sources.
- Data warehouse: Stores the integrated data.
- Reporting and visualization layer: Presents the insights in an understandable format like dashboards and charts.
Business intelligence combines business analytics, data mining, data visualization, data tools and infrastructure, and best practices to help organizations make more data-driven decisions.
Evolution of the Term
The term “business intelligence” has evolved significantly since Richard Millar Devens first used it in 1865, later refined by IBM’s Hans Peter Luhn in 1958, and popularized by Howard Dresner in 1989 as an umbrella term for decision support systems. In the 1960s and 1970s, the first data management systems and decision support systems began to store and organize the growing volumes of data. Recent developments in business intelligence focus on integrating artificial intelligence and machine learning to streamline tasks.
Business Intelligence (BI) is the combination of technologies, processes, and practices that collect, integrate, and analyze business data to support better decision-making. BI transforms raw data into actionable insights through dashboards, reports, and visual analytics. Business intelligence tools and BI platforms are the main systems and software used to collect, analyze, and visualize business data, enabling organizations to streamline analysis and support decision-making at all levels.
BI Tools and Platforms
Business intelligence combines business analytics, data mining, data visualization, data tools and infrastructure, and best practices to help organizations make more data-driven decisions. BI tools and platforms enable organizations to collect, analyze, and visualize business data, supporting both business users and data professionals.
Microsoft Power BI is a business analytics platform that enables users to connect to multiple data sources, model and transform data, create interactive dashboards, and share insights across organizations. It includes desktop, cloud, and mobile applications designed for both business users and data professionals. Key features of BI platforms and business intelligence tools include self-service analytics, interactive dashboards, and integration with modern technologies.
| Aspect | Description |
|---|---|
| Platform Name | Microsoft Power BI |
| Function | Business analytics platform for connecting, modeling, transforming data, and creating interactive dashboards |
| Applications | Desktop, cloud, and mobile applications |
| User Types | Business users and data professionals |
| Key Features | Self-service analytics, interactive dashboards, integration with modern technologies |
Why BI Is Important in Modern Businesses
Benefits of BI
Business intelligence delivers measurable value across organizations by accelerating data-driven decisions. Decision makers gain visibility into performance metrics like revenue trends, operational bottlenecks, and customer behavior
reducing guesswork and enabling faster responses.
Organizations or companies can use the insights gained from BI and data analysis to:
- Improve business decisions
- Identify problems or issues
- Spot market trends
- Find new revenue or business opportunities
Companies leveraging BI tools effectively gain competitive advantage by discovering patterns in market trends early, optimizing pricing strategies, and improving customer segmentation. Real-time monitoring through interactive dashboards allows continuous KPI tracking and immediate response to emerging issues.
Business intelligence is as much a way of thinking as it is composed of hardware and software, requiring a data-driven culture to make better business decisions.
Data Visualization in BI
The data visualization process transforms complex datasets into clear, visual representations like charts and graphs, facilitating easier understanding and interpretation of insights by decision-makers in the business intelligence process.
Operational Efficiency
BI drives operational efficiency by uncovering inefficiencies in business processes, optimizing supply chain operations, reducing inventory costs, and improving resource allocation. Organizations like Lumen have eliminated approximately 10,000 manual hours through BI automation, demonstrating the tangible impact of modern BI solutions.
Key Components of a BI System
A typical BI system includes:
- Data integration: Gathers data from various sources
- Data warehouse: Stores the integrated data
- Reporting and visualization layer: Presents insights in dashboards and charts
Transition: Next, let’s explore the different types of BI and how they are used in organizations.
Types of BI Platforms
BI platforms are the tools that support different types of BI self-service, operational, and strategic by providing features such as dashboards, data visualization, and integration with other business systems. These platforms streamline data analysis and reporting, making it easier for users at all organizational levels to access and interpret data.
Operational BI
Operational BI focuses on real-time monitoring and tactical decision support. It provides alerts, live dashboards, and immediate visibility into day-to-day business operations, enabling quick responses to operational issues.
Strategic BI
Strategic BI delivers broader, long-range insights for executive-level planning. This includes trend analysis, forecasting, and comprehensive dashboards that shape organizational strategy and business strategy decisions.
Transition: Now that we’ve covered the types of BI, let’s look at what Power BI is primarily used for and who should use it.
What Power BI is Primarily Used For
Key Uses of Power BI:
- Creating interactive data visualization and real-time dashboards
- Building automated and ad-hoc business reports
- Connecting disparate data sources for unified analysis
- Tracking key performance indicators across departments
- AI-powered analytics including natural language queries
Who Should Use Power BI
- Business analysts needing to visualize data and create reports
- Data professionals responsible for data modeling and data preparation
- Executives requiring dashboards for strategic decision-making
- Functional teams (sales, marketing, finance) seeking self-service BI capabilities
BI vs Data Analytics
Business intelligence and data analytics serve complementary but distinct purposes. BI concentrates on historical data and current performance, answering “what happened” and “what is happening.” Data analytics extends into predictive analytics (“what might happen”) and prescriptive analytics (“what should we do”).
| Feature | Business Intelligence | Data Analytics |
|---|---|---|
| Focus | What has/is happening | Why it happened, what will happen, and prescriptive insights |
| Data Types | Structured (databases, ERP, Excel) | Structured + unstructured (text, images, logs) |
| Techniques | Reporting, dashboards, OLAP | Predictive modeling, machine learning, statistical analysis |
| Tools | Power BI, business intelligence platforms | Python, R, data science platforms |
| Users | Managers, business users, executives | Data scientists, data analysts, technical roles |
BI workloads typically use structured data from internal systems, while analytics often incorporates unstructured or external data including social media and IoT sensor data.
Business Intelligence Vs Business Analytics
Business analytics (BA) is a subset of BI that provides prescriptive, forward-looking analysis.
Both BI (Business Intelligence) and business analytics are vital, working together to provide companies with all four types of analytics: descriptive, diagnostic, predictive, and prescriptive. Traditional BI was driven by IT, requiring users to submit questions and wait for static reports, leading to slow reporting cycles.
Real-World Examples of BI
- Finance: Organizations track budgets versus actuals, forecast cash flows, analyze profitability by product or department, and monitor financial key performance indicators through consolidated dashboards.
- Sales: Sales teams leverage BI for pipeline forecasting, territory performance analysis, win/loss tracking, and customer data analysis to identify churn risks and growth opportunities.
- Marketing: Marketing departments measure campaign ROI, segment customers by demographics and behavior, analyze lead conversion rates, and optimize marketing spend through visual analytics.
- Operations: Operations teams optimize supply chain logistics, monitor inventory turnover, track production quality metrics, and measure operational KPIs like equipment downtime and throughput rates.
What Is Microsoft Power BI?
Power BI Definition
Microsoft Power BI is an interactive business intelligence and data visualization platform developed by Microsoft as part of the Microsoft Power Platform. Initially launched on July 24, 2015, Power BI evolved from Excel-based tools including Power Pivot, Power Query, and Power View.
Power BI provides a comprehensive power bi ecosystem for connecting to data sources, transforming data, building semantic models, creating interactive reports, and sharing insights across organizations. It combines cloud-based services with desktop applications to deliver end-to-end business analytics capabilities.
Key Components of Power BI
- Power BI Desktop: A Windows-based application for connecting to data sources, performing data transformation and data preparation, building semantic models, and creating detailed power bi reports. It serves as the primary development environment for report authors.
- Power BI Service: The cloud-based SaaS platform for publishing, sharing, and collaborating on reports and dashboards. It supports scheduled data refreshes, security management, and organizational distribution of business intelligence content.
- Power BI Mobile: Provides native iOS and Android applications for viewing dashboards and reports on mobile devices, enabling decision makers to access business insights anywhere.
- Power BI Gateway: Creates secure connections between on-premises data sources and the Power BI Service cloud, enabling data refresh and real-time access to organizational databases behind firewalls.
- Additional components: Power BI Embedded for integrating reports into custom applications, Power BI Report Server for on-premises report hosting, and dataflows for cloud-based ETL processes.
Power BI is one of several leading business intelligence tools that support data analysis and visualization, alongside other popular BI tools such as Tableau and Google Looker.
How Power BI Works (Step-by-Step)
- Connect to data sources: Use Power BI Desktop or Service to connect to multiple data sources including Excel files, SQL Server databases, Azure services, web APIs, Salesforce, and hundreds of other connectors.
- Transform and clean data: Power Query provides a visual interface for data transformation cleaning data, removing duplicates, filtering rows, reshaping tables through merge and append operations, and ensuring data quality. In a typical BI system, the integrated and cleansed data from these sources is stored in a data warehouse, which acts as a central repository before the data is used for reporting and visualization.
- Create data models and relationships: Define tables, establish relationships between fact and dimension tables, configure cardinality, and build the semantic model (dataset) that powers your reports.
- Build visualizations and reports: Use the report canvas to create charts, tables, cards, maps, and other visuals. Add interactivity through filters, slicers, drill-down capabilities, and custom formatting.
- Publish and share: Publish reports to Power BI Service, create dashboards, configure scheduled refreshes, set up row-level security, and distribute insights to power bi users across your organization.
What Is Power BI Used For?
Key Uses of Power BI
- Data visualization: Enables organizations to create interactive charts, graphs, and dashboards that reveal patterns and trends hidden in raw data. Power BI’s extensive visual library helps users visualize data effectively for different analytical needs. In addition to visualization, Power BI supports data mining, which involves exploring large datasets to uncover patterns, trends, and actionable insights.
- Reporting: Covers standard business reports, paginated reports through Power BI Report Builder, and ad-hoc analysis. Automated report distribution ensures stakeholders receive timely business insights.
- Business decision-making: Improves when executives and managers access real-time dashboards for both strategic planning and operational decisions. BI tools provide the evidence base for data-driven decisions.
- KPI tracking: Enables organizations to define, monitor, and respond to key performance indicators across departments. Custom dashboards display performance metrics against targets in real-time.
- ERP integration: Connects enterprise resource planning data including finance, inventory, and manufacturing information directly into Power BI. Integration with systems like LOGIC ERP provides unified visibility into business operations and automated business analytics from transactional systems.
Core Concepts of Power BI (Beginner to Advanced)
What Is a Dashboard in Power BI?
A dashboard in Power BI is a single-page view that aggregates visualizations and metrics from one or more reports. Dashboards provide at-a-glance monitoring of key performance indicators and support real-time data updates through live tiles.
Unlike reports, dashboards are designed for high-level overview rather than detailed analysis. They pull specific visuals from underlying reports, enabling users to see consolidated business metrics without navigating multiple pages.
What Is a Report in Power BI?
A power bi report is a multi-page collection of visualizations built from a single dataset. Reports support detailed analysis with interactive features including filters, slicers, drill-through navigation, and custom formatting.
Report authors create these in Power BI Desktop or the Power BI Service, designing pages that tell data stories and enable users to explore information interactively. Reports serve as the foundation from which dashboard tiles are created.
What Is a Dataset in Power BI?
A dataset (also called a semantic model) represents the underlying data imported into or connected to Power BI. It includes tables, relationships, measures, and queries that form the basis for reports and dashboards.
Datasets can use Import mode (data loaded into Power BI memory) or DirectQuery (live connection to source). Data access patterns and refresh schedules depend on the connection type and organizational requirements.
What Is Data Modeling in Power BI?
Data modeling is the process of organizing and structuring data for effective analysis. In Power BI, this involves creating relationships between tables, defining fact and dimension table structures, and optimizing the model for performance and usability.
Proper data modeling following star schema principles ensures efficient queries, predictable filter behavior, and accurate calculations. It forms the foundation for reliable business intelligence reporting.
What Is Data Visualization in Power BI?
Data visualization transforms numerical and categorical data into graphical representations charts, maps, tables, and other visual elements that communicate insights effectively. Power BI provides extensive visualization options for different analytical purposes.
Effective visualization follows principles of clarity, appropriate visual selection, consistent formatting, and purposeful interactivity. The goal is communicating data driven insights without cluttering displays or misleading viewers.
Power BI Data Modeling Explained
What Is a Star Schema in Power BI?
A star schema is a database design pattern featuring a central fact table surrounded by dimension tables in a star-like arrangement. This structure optimizes query performance and simplifies the data model for report development.
In Power BI, star schema designs leverage the VertiPaq compression engine effectively, resulting in better memory usage, faster visual rendering, and more predictable filter propagation. Microsoft recommends star schema as the standard approach for Power BI data modeling.
Fact Table vs Dimension Table
- Fact tables: Store measurable, quantitative business events sales amounts, order quantities, transaction counts. They contain many rows with foreign keys referencing dimension tables and numeric values for aggregation.
- Dimension tables: Hold descriptive attributes used for filtering and grouping product names, customer details, dates, locations. They typically have fewer rows with unique keys and categorical information that provides context to facts.
Together, fact and dimension tables create the analytical framework that powers business intelligence reports and enables meaningful data analysis across different perspectives.
Relationships in Power BI
- One-to-one relationships: Connect tables where each row in one table matches exactly one row in another. These are less common and typically occur between tables sharing the same grain.
- One-to-many relationships: Represent the standard pattern in Power BI, connecting dimension tables (one side) to fact tables (many side). Filter context flows from the dimension to the fact table.
- Many-to-many relationships: Connect tables where multiple rows can match on both sides. These require careful consideration as they can introduce ambiguity and performance impacts. Bridge tables often resolve many-to-many scenarios.
What Is Cardinality in Power BI?
Cardinality describes the uniqueness of values within relationship columns. Dimension tables have unique keys (high cardinality in the relationship column), while fact tables contain repeated foreign key values.
Power BI automatically detects cardinality when creating relationships, but understanding cardinality helps data analysts troubleshoot filter behavior and optimize model performance. Incorrect cardinality settings cause calculation errors and unexpected results.
What Is Granularity in Power BI?
Granularity (or grain) defines the level of detail stored in fact tables transaction-level, daily summaries, monthly aggregates. The grain determines what analyses are possible and affects storage requirements.
Choosing appropriate granularity balances analytical flexibility against performance. Finer grain provides more detail but increases model size; coarser grain improves performance but limits drill-down capabilities. Understanding granularity helps data engineers design effective data models.
What Is DAX in Power BI? (Important for SEO + AEO)
What Is DAX (Data Analysis Expressions)?
Data Analysis Expressions (DAX) is the formula language used in Power BI for creating custom calculations, measures, calculated columns, and calculated tables. DAX works with tabular data models to perform sophisticated data analysis operations.
DAX syntax resembles Excel formulas but operates fundamentally differently working with columns and tables rather than cell references. Understanding DAX is essential for power bi users who need calculations beyond basic aggregations.
DAX vs Excel Formulas
DAX operates on relational data models with awareness of filter context and row context, while Excel formulas work cell-by-cell with explicit range references. This architectural difference enables DAX to handle large datasets efficiently.
DAX includes table-returning functions and automatic filter propagation through relationships capabilities that don’t exist in Microsoft Excel. However, many function names are similar (SUM, AVERAGE, IF), making the transition easier for Excel users.
Common DAX Functions
- SUM vs SUMX: SUM aggregates a single column directly, while SUMX iterates over a table expression, evaluating a calculation for each row before summing results. SUMX provides more flexibility for complex calculations.
- CALCULATE: The most important DAX function, CALCULATE modifies filter context before evaluating an expression. It enables calculations under specific conditions like “sales this year” or “sales for selected product category.”
- ALL: Removes filters from specified tables or columns, enabling calculations that ignore user selections. Essential for creating percentage-of-total calculations and comparison measures.
- RELATED: Retrieves values from related tables based on established relationships. It enables accessing dimension attributes within fact table contexts.
What Is a Measure in Power BI?
A measure is a dynamic calculation evaluated at query time, responding to the current filter context set by slicers, filters, and visual groupings. Measures perform aggregations like sum, average, and count that update automatically as users interact with reports.
Measures are the preferred approach for most calculations in Power BI because they don’t increase model size and always reflect current filter selections. Creating well-organized measures with clear naming conventions improves report maintainability.
What Is a Calculated Column?
A calculated column adds a new column to a table, computing values row-by-row during data refresh. Unlike measures, calculated column values are stored in the model and consume memory.
Use calculated columns when you need values for filtering, grouping, or slicing situations requiring actual data values rather than aggregated results. However, prefer Power Query transformations when possible to maintain query folding benefits.
What Is a Calculated Table?
A calculated table creates an entirely new table using DAX expressions. Common uses include generating date tables, creating summary tables, and building custom lookup tables for specific analytical needs.
Calculated tables increase model size based on row counts, so use them judiciously. They’re valuable when you need derived structures not available from source data.
What Is Power Query in Power BI?
Query Editor Explained
Power Query provides the data transformation interface within Power BI Desktop and Service. Users connect to data sources and apply step-by-step transformations filtering rows, changing data types, merging tables, and cleaning data issues.
Applied Steps appear in sequence, showing the complete transformation history. Each step can be modified, reordered, or removed, creating a reproducible data preparation pipeline that runs automatically during refresh.
What Is Query Folding?
Query folding occurs when Power Query pushes transformation steps back to the data source for execution. Instead of downloading all data and transforming locally, folded queries let the database perform filtering and transformation dramatically improving performance.
Operations like filtering, column selection, and grouping typically fold well. Custom transformations, certain merge operations, and specific functions may break folding. Monitoring the View Native Query option helps identify folding status.
Data Transformation Techniques
- Merge queries: Combine data from multiple tables based on matching columns, similar to SQL joins. This enables consolidating data from different sources into unified analytical tables.
- Append queries: Stack rows from similar-structured tables vertically, useful for combining monthly files or regional datasets into single tables for analysis.
- Unpivot: Transforms wide formats (many columns) into long formats (fewer columns, more rows), normalizing data for better analysis and visualization in Power BI.
What Is M Code?
M is the functional programming language underlying Power Query transformations. Every visual step in Query Editor generates M code that users can view and edit directly for advanced scenarios.
M enables parameterization, custom functions, and complex transformations beyond the visual interface. While most users work primarily through the graphical editor, understanding M basics helps troubleshoot issues and implement sophisticated data preparation logic.
Filters, Slicers & Interactivity in Power BI
What Is a Filter in Power BI?
Filters limit data displayed in visuals, pages, or entire reports. Power BI provides visual-level filters affecting single visuals, page-level filters affecting all visuals on one page, and report-level filters affecting the entire report.
Filter precedence flows from report to page to visual level, with more specific filters overriding broader ones. Understanding filter hierarchy helps authors design reports with appropriate default views while enabling user exploration.
What Is a Slicer in Power BI?
Slicers are interactive filter controls placed directly on report pages, enabling end users to filter data by selecting values. They provide intuitive data exploration without requiring users to understand the filter pane.
Slicer types include list (multiple selection), dropdown (single or multiple selection), date range (slider or calendar), and numeric range controls. Formatting options customize appearance, selection behavior, and visual integration with report design.
What Is Drill Down and Drill Through?
- Drill down: Navigates hierarchical data levels within the same visual. For example, clicking a year reveals quarters, then months, then days exploring progressively finer granularity.
- Drill through: Navigates to a separate detail page while carrying filter context from the source visual. Users right-click on data points to access detailed information pages designed for specific analytical purposes.
What Is Sync Slicer?
Sync slicer enables one slicer to control filters across multiple report pages. When users select values, those selections apply to synchronized pages automatically.
Configuration specifies which pages receive sync selections and whether the slicer appears visibly on each page. This ensures consistent filtering experience when users navigate between related report pages.
Power BI Visualizations Explained
Types of Visuals
- Card: Displays single values totals, counts, or key metrics prominently on dashboards and reports for immediate visibility.
- Matrix: Presents cross-tabulated data in rows and columns, supporting grouping, hierarchies, and conditional formatting similar to pivot tables.
- Pie chart: Shows proportional relationships as parts of a whole, useful for percentage distributions across limited categories.
- Scatter plot: Displays relationships between two numerical variables, revealing correlations, clusters, and outliers in data.
- Gauge: Indicates progress toward goals with needle displays, showing current values against minimum, maximum, and target thresholds.
- Heatmap: Uses color intensity to represent data density or values across two categorical dimensions, revealing patterns in large datasets.
What Is a KPI in Power BI?
A KPI visual displays key performance indicators with value, goal/target, trend direction, and status indication. Organizations use KPIs to monitor critical business metrics against defined thresholds.
Effective KPI design includes clear value formatting, meaningful threshold colors (red/yellow/green), and trend indicators showing performance direction. KPIs provide immediate visibility into whether metrics meet organizational targets.
What Is Legend and Tooltip?
- Legends: Explain visual elements and color coding, helping viewers understand what different colors, shapes, or sizes represent in charts and graphs.
- Tooltips: Display additional information when users hover over visual elements. Power BI supports default tooltips showing data values, custom tooltips with additional fields, and report page tooltips displaying detailed context using separate report pages.
Advanced Power BI Features
What Is Row-Level Security (RLS)?
Row-level security restricts data access at the row level based on user roles. Different users see different data subsets from the same reports, ensuring appropriate data access controls.
RLS rules can be static (fixed filter expressions) or dynamic (using USERNAME() or USERPRINCIPALNAME() functions). Testing RLS configurations thoroughly ensures security works correctly before deployment.
What Is Incremental Refresh?
Incremental refresh updates only new or changed data partitions instead of refreshing entire tables. This dramatically reduces refresh times and resource consumption for large datasets.
Configuration uses RangeStart and RangeEnd parameters to define refresh boundaries. Combined with hybrid tables supporting real-time partitions, incremental refresh enables efficient large-scale data management.
What Is DirectQuery?
DirectQuery maintains live connections to data sources, querying source systems when visuals render rather than importing data into Power BI. This approach suits frequently changing data and very large datasets.
DirectQuery introduces latency since every visual interaction triggers source queries. Performance depends on source system capabilities, and some Power BI features have limitations in DirectQuery mode. Careful optimization ensures acceptable user experience.
What Is Bookmark in Power BI?
Bookmarks capture report state including filter selections, slicer values, and visual visibility. Authors use bookmarks to create navigation experiences and guided storytelling within reports.
Personal bookmarks let individual users save their preferred views, while shared bookmarks are published by authors for all report viewers. Buttons linked to bookmarks enable intuitive navigation interfaces.
What Is Power BI Gateway?
Power BI Gateway bridges on-premises data sources with cloud-based Power BI Service, enabling secure data refresh and real-time connections through organizational firewalls.
Personal mode gateways support individual users, while Enterprise gateways provide shared infrastructure for organizational deployments. Gateway configuration requires network and security considerations for reliable operation.
Power BI Platform & Components
Power BI Desktop vs Service
Power BI Desktop serves as the primary development environment a Windows application for data connection, transformation, modeling, and report creation. Authors build complete reports locally before publishing.
Power BI Service is the cloud platform for sharing, collaboration, scheduled refresh, and consumption. It provides dashboard creation, workspace management, security administration, and distribution capabilities.
The typical workflow involves developing in Desktop, publishing to Service, then configuring sharing, refresh schedules, and access permissions in the cloud environment.
What Is Power BI Workspace?
Workspaces are collaborative containers for dashboards, reports, and datasets. They enable teams to develop, share, and manage content together with appropriate role-based permissions.
Workspace roles include:
- Admin (full control)
- Member (publish and edit)
- Contributor (create content)
- Viewer (consume only)
Organizations use workspaces to organize content by department, project, or data domain.
What Is Power BI App?
A Power BI App packages dashboards and reports for distribution to end users. Apps provide curated content experiences separate from underlying workspace development activities.
Authors publish apps from workspaces, and users install apps to access approved content. Apps can be updated centrally, pushing changes to all installed instances without requiring user action.
What Is Power BI Cloud?
Power BI Cloud refers to Microsoft’s global infrastructure hosting Power BI Service. It provides enterprise-grade availability, security certifications, data residency options, and compliance with regulatory requirements.
Integration with Microsoft Fabric extends cloud capabilities with unified data governance, shared compute capacity, and seamless connections to Azure data services. Organizations benefit from Microsoft’s ongoing infrastructure investments.
Power BI for Careers & Learning
What Is a Power BI Developer?
A Power BI Developer is a professional role responsible for end-to-end BI solution development. Responsibilities include data engineering, data modeling, DAX development, report and dashboard design, integration with source systems, and governance implementation.
Career progression may lead to senior developer roles, BI architect positions, or data analytics leadership. Demand for Power BI skills continues growing as organizations prioritize data-driven decisions.
Skills Required to Learn Power BI
Essential skills include:
- Data analysis fundamentals
- Basic SQL and database concepts
- Proficiency with Microsoft Excel
Understanding relational data structures helps with effective data modeling.
Additional valuable skills include:
- Data preparation techniques
- Statistical reasoning
- Visual design principles
- Understanding of business processes
Business acumen helps translate organizational needs into effective BI solutions.
Power BI Certification & Courses
Microsoft’s PL-300 Power BI Data Analyst certification validates professional competency in data modeling, visualization, and analytics using Power BI. The exam covers practical skills required for business analyst roles.
Learning resources include Microsoft Learn’s free training modules, official documentation, and community tutorials. Third-party platforms offer structured courses ranging from beginner introductions to advanced DAX and data modeling topics.
Future Scope of Power BI
Power BI continues evolving with artificial intelligence integration including Copilot capabilities, natural language queries, automated insights, and anomaly detection. These features make data analysis more accessible to business users.
Trends include increased cloud adoption, hybrid architectures combining import and DirectQuery, real-time streaming analytics, and tighter integration with enterprise systems. Organizations increasingly rely on modern BI solutions for competitive advantage.
Benefits of Power BI for Businesses
- Real-time insights: Provide immediate visibility into business performance. Dashboards displaying current operational metrics enable rapid response to emerging situations and opportunities.
- Data-driven decisions: Replace intuition with evidence-based planning. Consistent metrics and unified data views ensure stakeholders work from the same trusted information foundation.
- ERP integration: With systems like LOGIC ERP, connects transactional data directly to Power BI. Finance, inventory, production, and sales information flows into unified dashboards without manual data extraction and consolidation.
- Improved reporting: Reduces manual effort through automated refresh and distribution. Interactive reports replace static spreadsheets, enabling stakeholders to explore information independently.
- Scalability: Supports business growth through Power BI Premium and Fabric capacities. As data volumes increase and user counts grow, the platform handles larger workloads without rebuilding infrastructure.
- Customer insights: BI analyzes customer behavior, preferences, and purchasing habits to improve marketing campaigns and customer satisfaction.
- Trend identification: Organizations can quickly identify and act on new trends and opportunities with timely business intelligence.
- Increased profitability: Implementing business intelligence can lead to increased revenue and profitability by providing insights into risks and opportunities.
Transition: Next, let’s see how Power BI compares to other tools and why integrating it with LOGIC ERP can be a game-changer for your business.
Power BI vs Other Tools (Generic, No Competitor Focus)
Compared to generic BI tools, Power BI provides comprehensive capabilities spanning data preparation, data modeling, visualization, and collaboration within a unified platform. Microsoft ecosystem integration offers advantages for organizations already using Microsoft technologies.
Power BI vs Excel represents a common comparison:
- Excel excels at ad-hoc analysis with smaller datasets and remains familiar to business users.
- Power BI scales to larger data volumes, supports relational models, provides richer visualization options, and enables better sharing and collaboration.
Integration capabilities connect Power BI with hundreds of data sources and business applications. Cost considerations vary by license tier Free, Pro, and Premium options with additional capabilities and capacity-based pricing.
Why Choose LOGIC ERP Power BI Software?
LOGIC ERP Power BI software offers a powerful integration that connects your enterprise resource planning (ERP) transactional data directly with Microsoft Power BI’s advanced business intelligence platform. This seamless connection provides organizations with real-time operational visibility, automated reporting, and interactive dashboards all within a unified business intelligence system.
Key Benefits
- Eliminate Manual Data Handling: Automate data extraction and consolidation to improve data quality and reduce errors.
- Real-Time Insights: Access up-to-date information through interactive dashboards, enabling faster, data-driven decisions.
- Empower Business Users: Support a data-driven culture by providing self-service BI capabilities that allow users to explore and analyze relevant data independently.
- Advanced Analytics: Leverage AI-powered analytics and data modeling to uncover actionable insights from multiple data sources.
- Operational Efficiency: Enhance supply chain management, monitor key performance indicators (KPIs), and optimize business processes by streamlining workflows and supporting business process automation.
- Scalable Analytics Infrastructure: Grow your analytics capabilities alongside your business with a robust, scalable solution.
Why It Matters
By integrating LOGIC ERP with Power BI, organizations gain a competitive advantage through improved decision-making, streamlined operations, and comprehensive visibility into business performance. This integration transforms raw business data into meaningful insights that drive growth, innovation, and strategic planning.
Choosing LOGIC ERP Power BI software is ideal for businesses seeking to harness the full potential of their data and foster a culture of informed, data-driven decisions.
Conclusion
Business Intelligence transforms how organizations understand and respond to business data. From collecting raw information through presenting actionable insights, BI enables data-driven decisions that create competitive advantage.
Microsoft Power BI provides the complete platform for modern business intelligence connecting to data sources, modeling relationships, creating visualizations, and sharing insights across teams. Understanding core concepts from dashboards and DAX to data modeling and security prepares professionals for effective BI implementation.
Organizations integrating Power BI with enterprise systems like LOGIC ERP gain unified visibility into operations, automated reporting capabilities, and scalable analytics infrastructure. The combination of ERP transactional data with Power BI visualization delivers immediate business value.
Next steps for getting started:
- Download Power BI Desktop free from Microsoft and explore sample datasets
- Complete Microsoft Learn’s Power BI learning paths for structured skill development
- Consider PL-300 certification to validate your Power BI expertise
- Evaluate how Power BI integration with LOGIC ERP, can improve your organization’s business analytics capabilities
Call at +91-73411-41176 or send us an email at sales@logicerp.com to book a free demo today!
Frequently Asked Questions (FAQs)
1. What is Power BI in simple terms?
Power BI is Microsoft’s business analytics tool that helps you visualize data and share insights. You connect to your data sources, create interactive charts and dashboards, and share reports with colleagues to make better business decisions.
2. What is DAX in Power BI?
DAX (Data Analysis Expressions) is the formula language in Power BI for creating custom calculations. It’s used to build measures, calculated columns, and calculated tables that perform aggregations and complex analyses based on your data model.
3. What is a dashboard in Power BI?
A dashboard is a single-page view displaying key metrics and visuals from one or more reports. It provides at-a-glance monitoring of important business indicators with real-time updates.
4. What is Power BI used for?
Power BI is used for data visualization, creating business reports, tracking KPIs, making data-driven decisions, and connecting disparate data sources into unified analytical views accessible across organizations.
5. What is data modeling in Power BI?
Data modeling is structuring your data through tables, relationships, and calculations to enable effective analysis. Good data models follow star schema design with fact and dimension tables properly related.
6. What is a slicer in Power BI?
A slicer is an interactive filter control on report pages that lets users select values to filter data. Slicers provide intuitive data exploration without requiring users to use filter panels.
7. What is KPI in Power BI?
A KPI (Key Performance Indicator) visual displays a metric’s current value compared to a target, with trend indication and status coloring showing whether performance meets defined thresholds.
8. What is Power BI Desktop?
Power BI Desktop is the Windows application for developing reports connecting to data sources, transforming data, building models, and creating visualizations before publishing to Power BI Service.
9. What is Power BI Service?
Power BI Service is the cloud-based platform for sharing reports, creating dashboards, scheduling data refreshes, managing security, and collaborating with colleagues on business analytics content.
10. What is DirectQuery in Power BI?
DirectQuery is a connection mode where Power BI queries data sources live rather than importing data. It suits large datasets and frequently changing data but introduces query latency.
11. What is RLS in Power BI?
RLS (Row-Level Security) restricts data access at the row level based on user roles. Different users see different data from the same reports based on configured security rules.
12. Why choose LOGIC ERP Power BI integration?
LOGIC ERP integration with Power BI connects your transactional business data directly to interactive dashboards. This eliminates manual data extraction, provides real-time operational visibility, and enables automated reporting from your ERP system.
13. What Does “BI” Mean?
In business contexts, BI stands for Business Intelligence the technologies, practices, and strategies for analyzing data to support better decision-making. BI encompasses data collection, integration, analysis, and presentation.
The term has evolved from early decision support systems through data warehousing eras to current modern business intelligence platforms enabling self-service analytics for business users.
14. What Does “Bi-Weekly” Mean?
Bi-weekly commonly means “every two weeks” or “twice per week” depending on context. In business reporting contexts, bi-weekly typically refers to every-two-week cadence for recurring reports or meetings.
Clarity matters when scheduling bi-weekly activities. Explicitly stating “every two weeks” or “twice weekly” prevents miscommunication about report delivery or meeting frequency.
15. What Does “Bi-Monthly” Mean?
Bi-monthly can mean “every two months” or “twice per month” based on usage context. Business reporting often uses monthly or quarterly cadences, with bi-monthly less common.
When specifying bi-monthly schedules for business reviews or reporting cycles, explicit clarification prevents scheduling confusion among stakeholders.
16. What Is a BI Party System? (Brief explanation)
In political science, a “bi-party system” or “two-party system” refers to political structures dominated by two major parties. This usage is unrelated to Business Intelligence terminology.
The abbreviation “BI” in political contexts differs entirely from its business analytics meaning. Context determines whether “BI” references Business Intelligence or other abbreviated terms.
17. What are BI Tools with artificial intelligence?
Many modern BI tools leverage artificial intelligence (AI) and machine learning (ML) to automate analysis and improve decision-making. BI tools are designed to be user-friendly, enabling non-technical users to create reports and perform data analysis.
18. What are BI dashboards?
BI dashboards provide a quick, high-level overview of key metrics, often in real-time, using charts and graphs.
19. What are business intelligence tools and how do they help organizations?
Business intelligence tools are software applications designed to collect, analyze, and visualize business data from multiple data sources. These tools enable organizations to transform raw data into actionable insights through interactive dashboards, reports, and visual analytics. By using business intelligence tools, companies can improve decision-making, monitor key performance indicators, and identify market trends to gain a competitive advantage.
20. How does a business intelligence system work?
A business intelligence system integrates data from various sources into a centralized data warehouse, where data is cleaned, modeled, and prepared for analysis. The system then uses business intelligence platforms and BI tools to create reports and dashboards that help business users visualize data and uncover meaningful insights. This process supports data-driven decisions across operational, tactical, and strategic levels.
21. What is the difference between business intelligence and business analytics?
Business intelligence focuses on descriptive analytics analyzing historical and current data to answer “what happened” and “what is happening.” In contrast, business analytics extends into predictive and prescriptive analytics, helping organizations understand “why it happened,” forecast future trends, and recommend actions. Both disciplines complement each other and are often integrated within modern business intelligence platforms.
22. Who is a business intelligence analyst and what do they do?
A business intelligence analyst is a professional who collects, analyzes, and interprets business data to provide actionable insights that improve organizational performance. They use BI tools and data analysis expressions (DAX) to create reports and dashboards, helping decision-makers understand key performance metrics and market trends. Their role bridges data science and business strategy to support data-driven decision-making.
23. What are business intelligence platforms and why are they important?
Business intelligence platforms are comprehensive software solutions that offer capabilities for data integration, modeling, visualization, and reporting. They empower business users to create reports, interactive dashboards, and perform self-service BI without extensive technical skills. These platforms enable organizations to consolidate data from multiple sources, ensuring data quality and accessibility for faster, more informed decisions.
24. How do BI tools support data analysts in creating reports?
BI tools support data analysts in creating reports by providing user-friendly platforms that enable them to connect to multiple data sources, transform and clean raw data, and build data models. These tools offer interactive dashboards and visual analytics features that help analysts visualize data effectively, uncover patterns, and generate actionable insights. BI tools often include functionalities like drag-and-drop report creation, automated data refresh, and integration with other business systems, which streamline the reporting process and allow analysts to deliver timely, accurate reports that support data-driven decision-making across the organization.

Author
Gurbir Singh
Co-founder & Managing Director | LOGIC ERP Solutions Pvt. Ltd.
With 30+ years of experience in the tech industry, I took the helm of technology & product development, ensuring LOGIC ERP’s continuous innovation & leadership in the evolving tech landscape.

