How to Know Which Grocery Products Are Actually Making You Money?

Summary
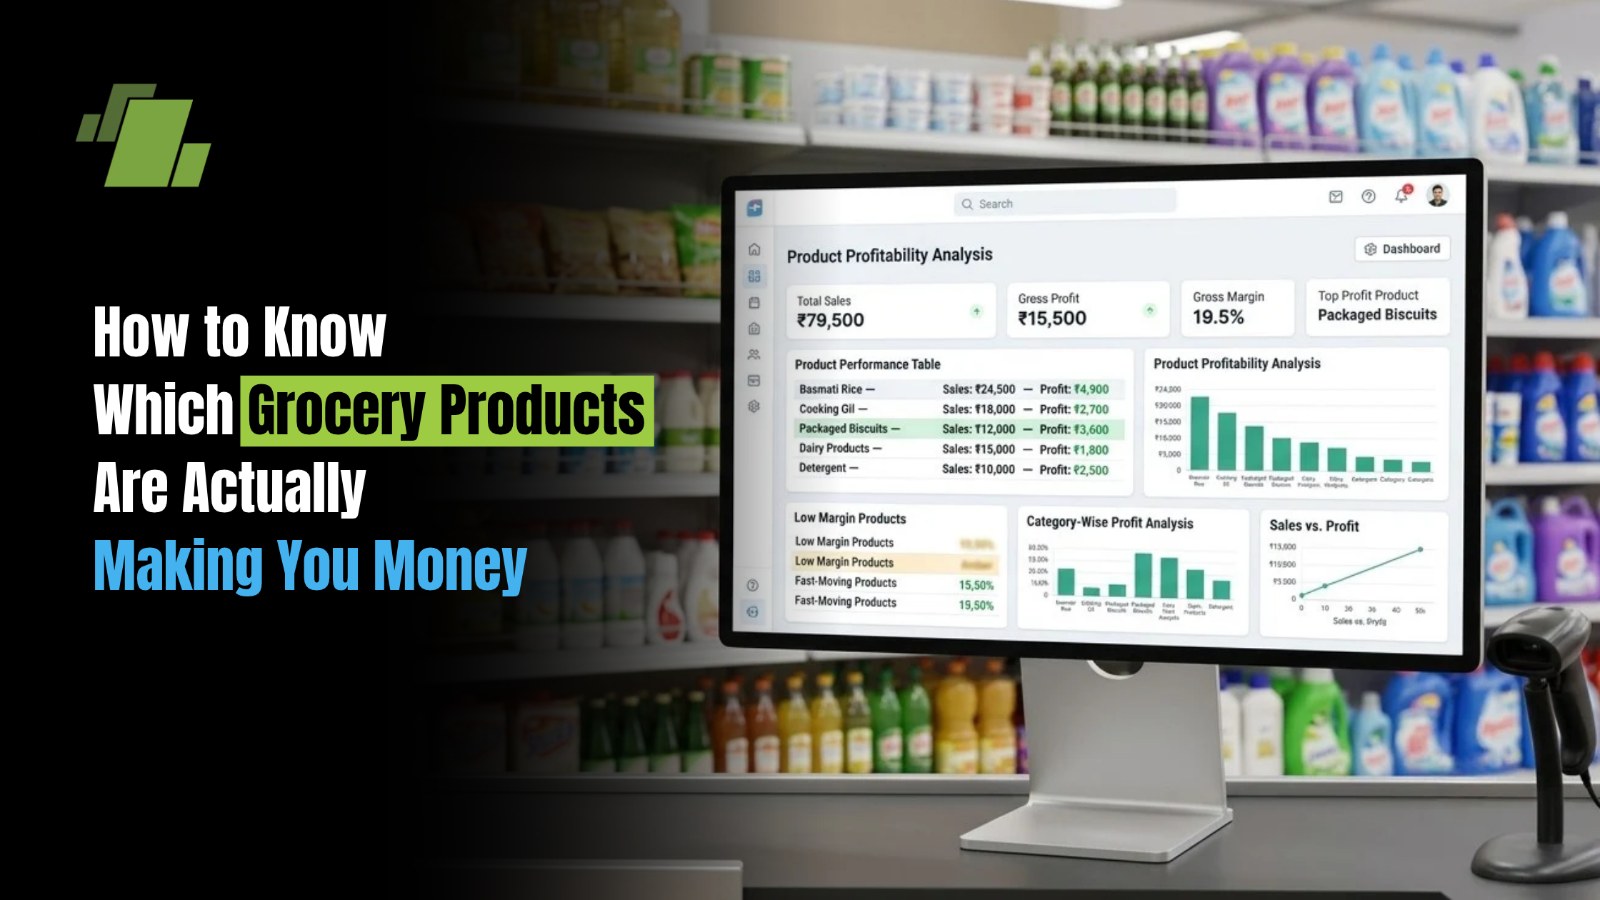
Identifying the most profitable grocery products requires retailers to analyse more than just sales volume. By tracking product-wise revenue, purchase costs, gross margins, discounts, stock turnover, and inventory movement, grocery retailers can identify high-profit products, control slow-moving stock, optimise pricing, and improve purchasing decisions. LOGIC ERP Grocery POS helps centralise sales, inventory, and profitability data, enabling retailers to make informed, data-driven decisions and improve overall grocery store profitability.
Contact Us
Free Demo Request
Key Takeaways
To know which grocery products are actually making money, retailers should look beyond sales volume and analyse revenue, purchase cost, gross margin, discounts, stock movement, and inventory performance together.
The most useful questions to ask are:
-
Which products generate the highest gross margin?
-
Which products sell quickly but have low margins?
-
Which products have strong margins but poor movement?
-
Which products are affected by frequent discounts?
-
Which categories contribute the most profit?
-
Which products are tying up working capital?
-
Which products should be reordered more frequently?
-
Which products may need pricing or assortment changes?
A grocery POS and inventory management system can bring these metrics together, giving retailers a clearer view of product-level profitability and helping them make data-driven purchasing, pricing, and inventory decisions.
A grocery store can sell thousands of products every month, but high sales volume does not always mean high profitability. Some products may sell quickly while generating very little margin, whereas slower-moving products can contribute significantly more to overall profits.
To understand which grocery products are actually making money, retailers need to look beyond sales volume and analyse product-level revenue, purchase cost, selling price, gross margin, discounts, stock movement, and profitability.
A grocery POS and inventory management system such as LOGIC ERP can help retailers bring these numbers together and make better decisions about pricing, purchasing, promotions, and inventory.
Why Sales Volume Alone Does Not Show Profitability
One of the most common mistakes in grocery retail is judging product performance only by the number of units sold.
For example:
|
Product |
Units Sold |
Selling Price |
Margin/Product |
Total Gross Margin |
|
Product A |
1,000 |
₹50 |
₹2 |
₹2,000 |
|
Product B |
300 |
₹100 |
₹15 |
₹4,500 |
Product A sells more units, but Product B generates more gross margin.
This is why grocery retailers should track profitability alongside sales volume.
A product profitability analysis can answer questions such as:
-
Which products generate the highest gross margin?
-
Which products sell frequently but provide low margins?
-
Which products have declining profitability?
-
Which products are affected by excessive discounts?
-
Which categories contribute the most profit?
-
Which products are tying up working capital without generating sufficient returns?
What Metrics Should Grocery Stores Track?
To identify profitable grocery products, retailers should monitor several metrics together rather than relying on a single number.
1. Sales Revenue
Sales revenue shows how much money a product generates through sales.
Sales Revenue = Selling Price × Quantity Sold
However, revenue alone does not represent profit because it does not account for purchase cost, discounts, or other costs.
2. Purchase Cost
Purchase cost is the amount paid to acquire the product from the supplier.
Accurate purchase costs are important because even a small change in procurement price can affect product margins.
For grocery retailers dealing with frequent supplier price changes, maintaining updated purchase costs helps ensure that profitability calculations remain accurate.
3. Gross Margin
Gross margin shows the difference between the selling price and purchase cost.
Gross Margin = Selling Price − Cost Price
For example:
-
Selling price = ₹100
-
Purchase cost = ₹80
-
Gross margin = ₹20
The retailer can also calculate the gross margin percentage:
Gross Margin % = (Gross Margin ÷ Selling Price) × 100
In this example:
₹20 ÷ ₹100 × 100 = 20%
4. Discount Impact
Discounts can increase sales but reduce the margin earned on each product.
Retailers should therefore compare:
Original Selling Price → Discount → Actual Selling Price → Final Margin
This helps determine whether promotional pricing is actually improving profitability.
5. Stock Turnover
A product with a high margin is not necessarily a good product if it remains in inventory for months.
Stock turnover helps retailers understand how quickly products are being sold and replenished.
A useful product analysis should therefore consider both:
-
How much margin a product generates
-
How quickly the product moves
6. Dead Stock
Products that remain unsold for extended periods can tie up capital and eventually require discounts or clearance sales.
Retailers should identify:
-
Non-moving products
-
Slow-moving products
-
Aging inventory
-
Expiry-sensitive inventory
-
Overstocked products
This provides a more realistic view of product profitability.
How to Identify Your Most Profitable Grocery Products
A systematic product profitability analysis can be performed using the following steps.
Step 1: Analyse Product-Level Sales
Start by reviewing sales data for individual products rather than looking only at total store sales.
Compare:
-
Units sold
-
Sales value
-
Average selling price
-
Sales frequency
-
Sales contribution
This helps identify products that consistently generate revenue.
Step 2: Compare Sales With Purchase Cost
Next, compare selling prices with actual purchase costs.
For example:
Product A
-
Purchase cost: ₹80
-
Selling price: ₹100
-
Margin: ₹20
Product B
-
Purchase cost: ₹95
-
Selling price: ₹105
-
Margin: ₹10
Even if both products sell similar quantities, Product A contributes twice the gross margin per unit.
Step 3: Calculate Product-Level Margins
Do not rely only on category-level profitability.
Analyse individual SKUs to identify:
-
High-margin products
-
Low-margin products
-
High-volume, low-margin products
-
Low-volume, high-margin products
-
Products with declining margins
This provides a clearer picture of where profits are coming from.
Step 4: Analyse Profitability by Category
After analysing individual SKUs, group products into categories.
For example:
-
Staples
-
Packaged foods
-
Beverages
-
Personal care
-
Home care
-
Dairy
-
Snacks
-
Confectionery
You may discover that one category contributes significantly more profit despite generating lower sales revenue than another category.
Step 5: Measure the Effect of Discounts
Promotions should not be evaluated only by increased sales.
Suppose a product normally generates ₹20 margin per unit. A discount reduces the margin to ₹8.
If sales increase substantially, the promotion may still be worthwhile - but retailers need data to determine whether the additional volume compensates for the lower margin.
Step 6: Identify Slow-Moving High-Margin Products
A high-margin product may appear profitable on paper but still be inefficient if it takes too long to sell.
Compare margin with stock movement to identify products that:
-
Generate good margins
-
Sell consistently
-
Require little inventory holding
-
Need frequent replenishment
These products can be particularly valuable to a grocery store.
Step 7: Identify High-Sales, Low-Margin Products
Fast-moving products often attract customers, but some may contribute relatively little profit.
Retailers should monitor products that have:
-
High sales volume
-
Low margins
-
Frequent discounts
-
High purchase costs
These products may require supplier negotiation, pricing adjustments, or better procurement strategies.
High-Selling Products vs High-Profit Products
These two categories should not be treated as the same.
|
Product Type |
Sales Volume |
Margin |
Business Insight |
|
High Sales + High Margin |
High |
High |
Strong profit contributor |
|
High Sales + Low Margin |
High |
Low |
Volume driver; review pricing |
|
Low Sales + High Margin |
Low |
High |
Improve visibility or placement |
|
Low Sales + Low Margin |
Low |
Low |
Consider reducing stock |
|
High Sales + Negative/Very Low Margin |
High |
Very Low |
Review pricing and procurement |
This classification helps retailers make more informed purchasing and merchandising decisions.
How Grocery POS Software Helps Track Product Profitability
Manual spreadsheets can make product-level profitability analysis difficult, particularly for stores managing thousands of SKUs.
A grocery POS system can centralise sales, inventory, purchasing, pricing, and margin information.
With LOGIC ERP Grocery POS, retailers can use business data to monitor product performance and make informed decisions about pricing, purchasing, inventory, and promotions.
Track Product-Wise Sales
Retailers can analyse sales at the SKU level to understand which products are selling and how frequently.
This can help answer:
-
Which products are best sellers?
-
Which products are declining?
-
Which products contribute most to sales?
-
Which products need replenishment?
Monitor Product Margins
Product-level margin analysis helps retailers compare selling prices with purchase costs and identify products that contribute more to gross profit.
Analyse Inventory Movement
Sales and inventory information can be evaluated together to identify fast-moving, slow-moving, and non-moving products.
This can help retailers reduce unnecessary inventory investment.
Evaluate Discounts and Pricing
Retailers can analyse whether discounts and price changes are improving sales without unnecessarily reducing margins.
Analyse Category Performance
Instead of looking at store-wide numbers alone, retailers can compare profitability across categories and product groups.
This can support better assortment and purchasing decisions.
How to Use Profitability Data for Better Purchasing Decisions
Profitability data becomes particularly valuable when retailers use it to influence purchasing.
Instead of ordering products simply because they sell well, retailers can consider:
Sales + Margin + Stock Movement + Inventory Investment
For example, a retailer may find that Product A sells 500 units but contributes ₹5,000 in gross margin, while Product B sells 250 units but contributes ₹7,500.
The retailer may decide to maintain strong availability for both, but the purchasing strategy can be different based on their contribution to profit.
How Product Profitability Can Improve Inventory Management
Knowing which products make money can also help retailers optimise inventory.
Prioritise Profitable Fast-Moving Products
Products with strong demand and healthy margins should generally receive close attention to availability and replenishment.
Reduce Overstocking
If a product has low sales and weak margins, excessive inventory can tie up working capital.
Monitor Aging Inventory
Products that remain unsold for long periods can eventually require discounts, clearance, or write-offs.
Consider Expiry and Shelf Life
For grocery products, profitability analysis should also consider expiry risk. A product that generates a good margin but frequently expires before sale may not be as profitable as it appears.
How to Improve Grocery Store Profitability Using Product Data
Once profitable and unprofitable products have been identified, retailers can take action.
Improve Procurement
Use sales and margin information to negotiate better purchase prices with suppliers.
Review Product Pricing
Products with consistently low margins may need pricing adjustments where market conditions allow.
Optimise Product Assortment
Give greater attention to products that provide a healthy combination of demand and profitability.
Reduce Unnecessary Discounts
Analyse whether promotions are generating incremental sales or simply reducing margins on products customers would have purchased anyway.
Improve Replenishment
Maintain adequate stock of profitable fast-moving products to reduce lost sales caused by stockouts.
Control Slow-Moving Inventory
Identify products that occupy valuable shelf and warehouse space without generating sufficient returns.
Example: Finding the Products That Actually Make Money
Consider a grocery store selling three products:
|
Product |
Monthly Sales |
Margin/Unit |
Monthly Gross Margin |
|
Rice |
₹2,00,000 |
5% |
₹10,000 |
|
Packaged Snacks |
₹1,00,000 |
18% |
₹18,000 |
|
Personal Care |
₹80,000 |
25% |
₹20,000 |
Rice generates the highest sales revenue, but Personal Care generates the highest gross margin in this example.
This shows why retailers should not automatically assume that their highest-selling category is their most profitable category.
A product profitability report makes these differences easier to identify.
Common Mistakes When Measuring Grocery Product Profitability
Looking Only at Revenue
High revenue does not necessarily mean high profit.
Ignoring Purchase Cost Changes
Supplier price changes can significantly affect margins.
Not Accounting for Discounts
A product may have a healthy standard margin but a much lower realised margin after promotions.
Ignoring Inventory Holding
Slow-moving products can consume working capital even when their nominal margins appear attractive.
Analysing Only Category-Level Data
Category-level averages can hide individual products that are either highly profitable or consistently underperforming.
Using Outdated Data
Profitability decisions based on old prices or purchase costs can lead to inaccurate conclusions.
Make Every Product Contribute to Your Grocery Store’s Profit
When you know which products generate revenue, which generate margins, and which tie up your inventory, you can make smarter decisions about what to stock, price, promote, and reorder.
Use LOGIC ERP Grocery POS to analyse product performance and make data-driven decisions that can improve grocery store profitability.

Call at +91-73411-41176/75 or send us an email at sales@logicerp.com to book a free demo today!
Frequently Asked Questions
How do I Know Which Grocery Products are Most Profitable?
Compare each product's sales revenue, purchase cost, selling price, discounts, and quantity sold. Product-level gross margin and total margin contribution provide a better picture of profitability than sales volume alone.
Is the Best-Selling Grocery Product Always the Most Profitable?
No. A best-selling product may have a very low margin, while a product with lower sales volume may generate significantly more gross profit per unit.
What is the Most Important Metric for Grocery Product Profitability?
Gross margin is an important starting point, but retailers should also consider sales volume, stock turnover, discounts, inventory holding, and expiry or wastage risk.
How can Grocery Stores Improve Product Margins?
Retailers can negotiate better purchase prices, review selling prices, reduce unnecessary discounts, optimize product assortment, improve replenishment, and identify slow-moving inventory.
Can POS Software Track Product-Wise Profitability?
Yes. Modern grocery POS and ERP systems can combine sales, purchasing, pricing, and inventory data to help retailers analyse product-level sales and margins.
How Does Inventory Affect Grocery Profitability?
Excess inventory can tie up working capital, while slow-moving or expiry-sensitive products can lead to markdowns and losses. Tracking inventory movement alongside margins gives retailers a more realistic view of profitability.
How can LOGIC ERP Help Grocery Stores Identify Profitable Products?
LOGIC ERP can help grocery retailers analyse product-wise sales, inventory movement, pricing, purchase information, and margins. This enables retailers to identify high-profit products, monitor low-margin items, manage stock more effectively, and make better purchasing and pricing decisions.

Author
Gurbir Singh
Co-founder & Managing Director | LOGIC ERP Solutions Pvt. Ltd.
With 30+ years of experience in the tech industry, I took the helm of technology & product development, ensuring LOGIC ERP’s continuous innovation & leadership in the evolving tech landscape.

