How Grocery Retailers Can Analyse Category-Wise Sales and Margins?

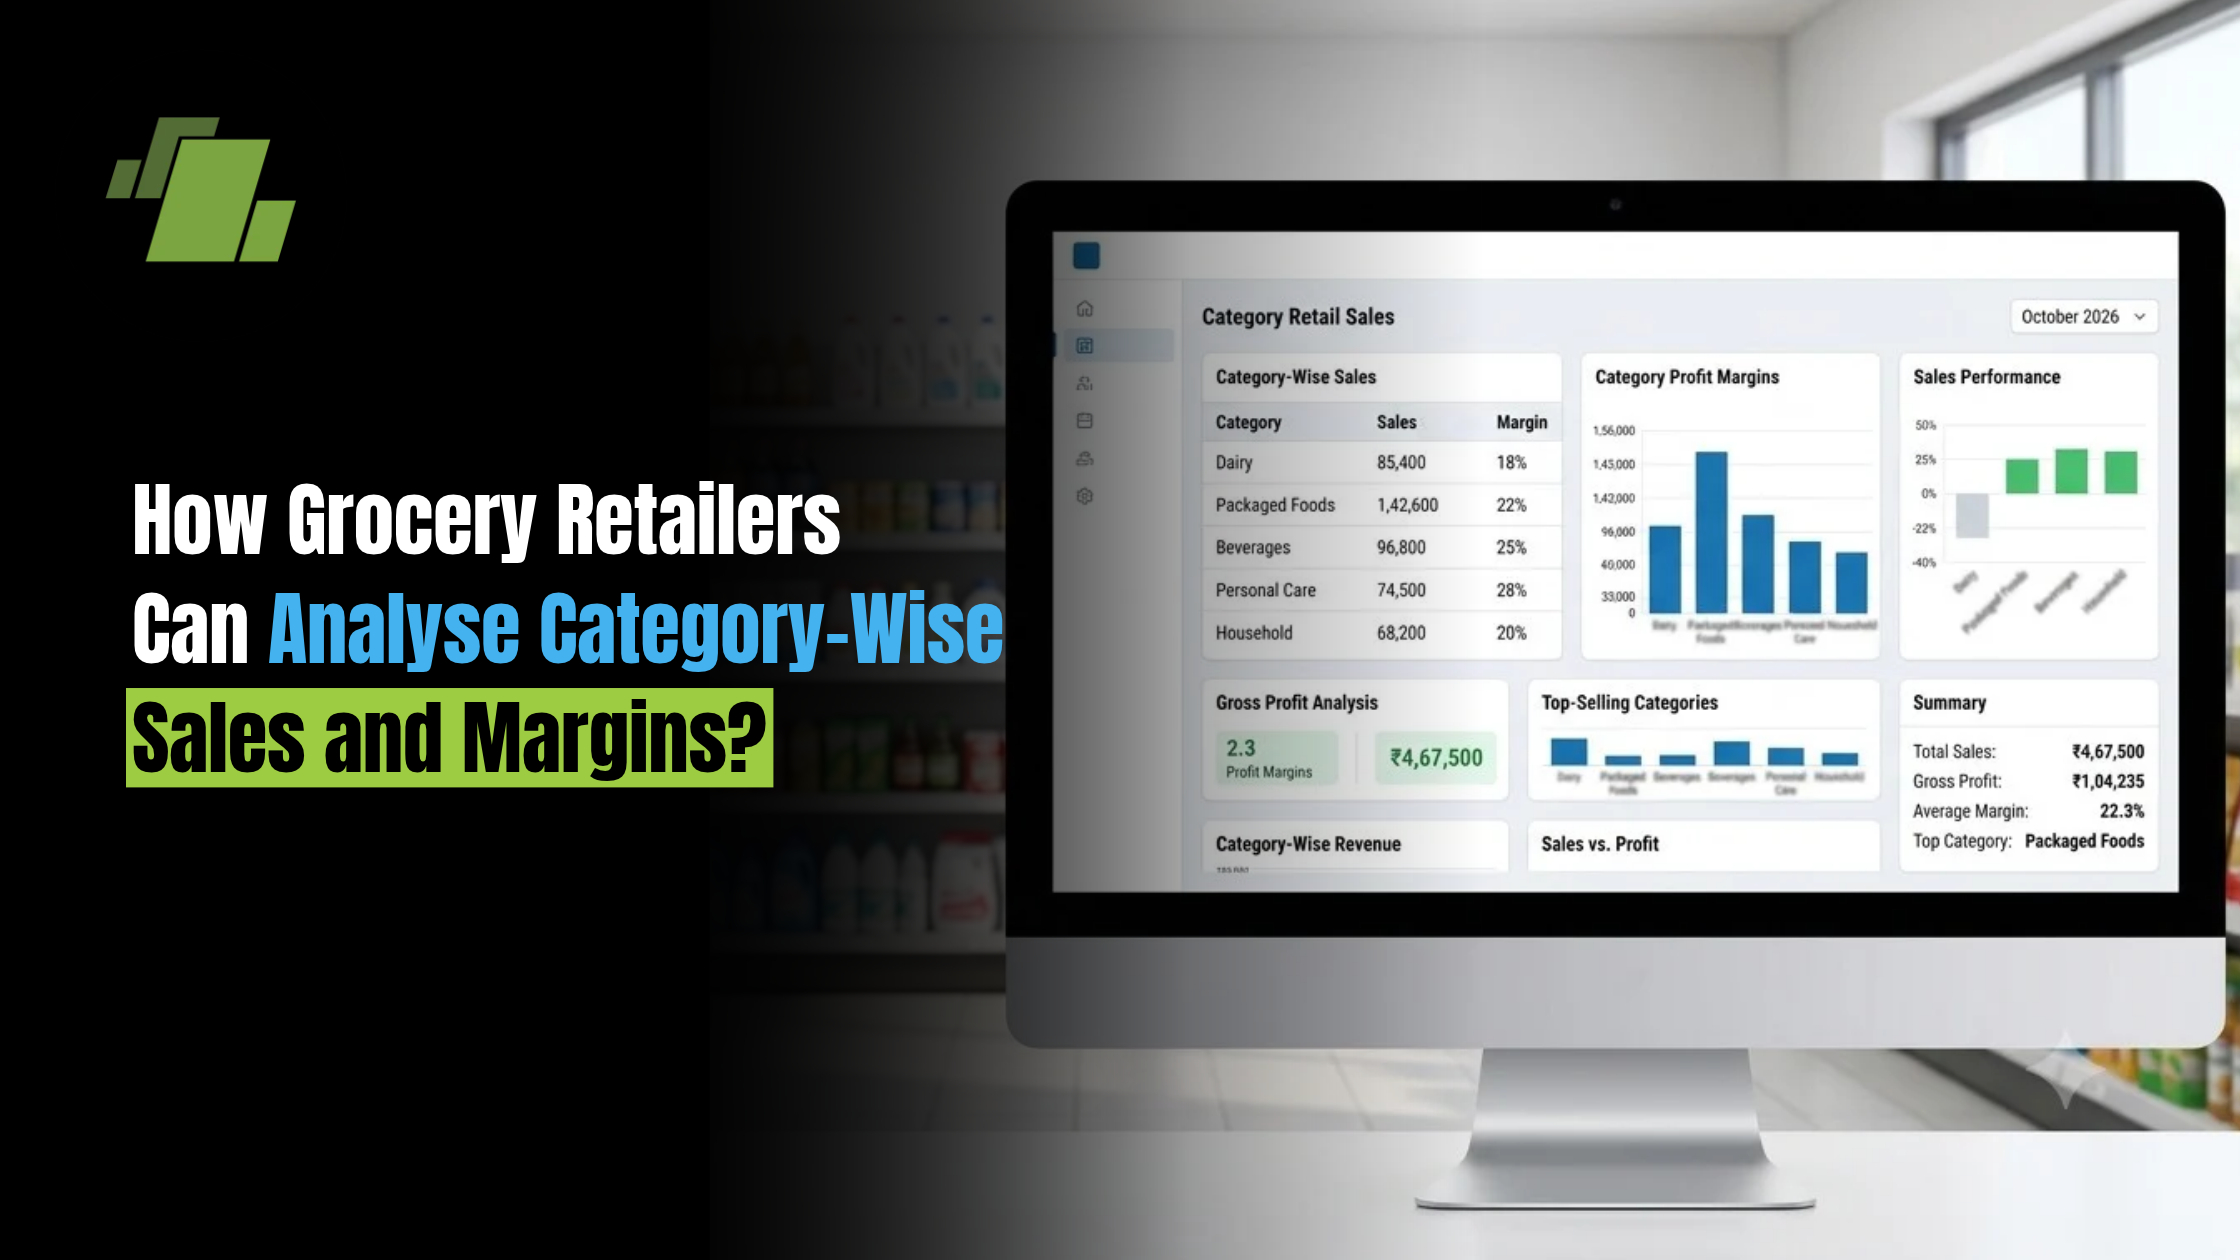
Knowing how much a grocery store sells is important, but total sales alone do not tell the complete story.
A grocery retailer may generate strong revenue from a particular category while earning relatively low margins. Another category may have lower sales but contribute significantly more to overall profitability. Without category-wise analysis, it can be difficult to identify which products are driving revenue, which categories are generating better margins, and where working capital is getting tied up.
Contact Us
Free Demo Request
Category-wise sales and margin analysis helps grocery retailers move beyond basic sales reporting. By analysing revenue, quantity sold, purchase cost, selling price, discounts, stock movement and profitability by category, retailers can make better decisions about purchasing, pricing, promotions and inventory.
What is Category-Wise Sales and Margin Analysis?
Category-wise sales analysis means breaking total store sales into individual product categories and evaluating their performance separately.
For example, a grocery retailer may analyse:
- Dairy products
- Beverages
- Packaged foods
- Staples
- Personal care
- Home care
- Snacks
- Confectionery
- Fresh produce
- Frozen foods
For each category, retailers can compare metrics such as:
- Sales value
- Units sold
- Purchase value
- Gross margin
- Margin percentage
- Discounts
- Stock quantity
- Stock turnover
- Contribution to total sales
This gives retailers a clearer picture of where revenue and profit are coming from.
Why Should Grocery Retailers Analyse Sales by Category?
Looking only at total sales can hide important differences between product groups.
For example, consider two categories:
| Category | Sales | Gross Margin | Gross Profit |
|---|---|---|---|
| Packaged Staples | ₹10 lakh | 8% | ₹80,000 |
| Personal Care | ₹5 lakh | 20% | ₹1,00,000 |
Packaged staples generate twice the sales of personal care, but personal care contributes more gross profit.
This is why grocery retailers should analyse both sales and margins instead of using revenue as the only measure of category performance.
Category-level analysis can help retailers:
- Identify profitable categories
- Find high-revenue, low-margin categories
- Identify slow-moving categories
- Improve purchasing decisions
- Evaluate discounts and promotions
- Optimise product assortment
- Reduce excess inventory
- Improve overall gross margin
1. Start With Accurate Category-Wise Sales Data
The first step is to organise products into meaningful categories and subcategories.
For example:
Beverages
- Soft drinks
- Juices
- Energy drinks
- Packaged water
Packaged Foods
- Biscuits
- Noodles
- Breakfast cereals
- Ready-to-eat foods
Personal Care
- Shampoo
- Skincare
- Oral care
- Hair care
A structured product hierarchy makes it easier to compare performance across categories instead of analysing thousands of individual SKUs separately.
2. Measure Sales Value and Units Sold Separately
Sales value tells you how much revenue a category generates. Units sold show how frequently products in that category are moving.
Both metrics are important.
A category may have high sales value because of expensive products but relatively low unit movement. Another category may sell thousands of units but generate lower revenue per item.
Retailers should therefore monitor:
- Total sales value
- Number of units sold
- Average selling price
- Average transaction value
- Sales contribution percentage
This provides a more complete picture of category performance.
3. Calculate Gross Margin by Category
Gross margin helps retailers understand how much money remains after accounting for the cost of goods sold.
A basic formula is:
Gross Profit = Net Sales − Cost of Goods Sold
And:
Gross Margin % = (Gross Profit ÷ Net Sales) × 100
For example, if a category generates ₹4 lakh in net sales and the cost of goods sold is ₹3.2 lakh:
Gross Profit = ₹4,00,000 − ₹3,20,000 = ₹80,000
Gross Margin = ₹80,000 ÷ ₹4,00,000 × 100 = 20%
Tracking this at category level helps retailers understand which product groups are contributing more profit.
4. Compare High-Sales Categories With High-Margin Categories
A category with high sales is not necessarily the most profitable category.
Retailers can divide categories into four broad groups:
| Category Type | Sales | Margin | Recommended Focus |
|---|---|---|---|
| High Sales + High Margin | High | High | Protect and expand |
| High Sales + Low Margin | High | Low | Review pricing and costs |
| Low Sales + High Margin | Low | High | Improve visibility and sales |
| Low Sales + Low Margin | Low | Low | Review assortment |
This framework can help retailers decide where to focus their attention.
5. Track Product-Level Contribution Within Each Category
Category-level analysis should not stop at the category itself.
Suppose the beverages category is performing well. The retailer should also identify which individual products are responsible for that performance.
Analyse:
- Top-selling SKUs
- Highest-margin SKUs
- Slow-moving SKUs
- Frequently discounted products
- Products with declining sales
- Products with high stock levels
This helps retailers identify whether a category is genuinely healthy or whether its performance depends on only a few products.
6. Analyse the Impact of Discounts and Promotions
Discounts can increase sales volume but may also reduce margins.
For every major promotion, retailers should compare:
Sales before promotion → Sales during promotion → Margin after discount
For example, a product may generate ₹1 lakh in sales at a 15% margin under normal pricing. A discount campaign could increase sales to ₹1.3 lakh but reduce the margin to 8%.
The retailer should evaluate whether the additional sales justify the reduction in profitability.
Category-wise promotional analysis can help retailers understand which offers actually contribute to business growth.
7. Compare Purchase Cost With Selling Price
Margin analysis depends on accurate purchase-cost information.
Retailers should monitor changes in:
- Supplier purchase prices
- Selling prices
- Discounts
- Promotional costs
- Taxes where applicable
- Purchase schemes
- Product-level landed cost
If supplier prices increase but selling prices remain unchanged, the category’s margin may gradually decline.
Regular margin analysis can help retailers identify these changes earlier.
8. Identify Categories With Declining Margins
A category can maintain stable sales while its profitability falls.
For example:
| Month | Sales | Margin |
|---|---|---|
| July | ₹6 lakh | 18% |
| August | ₹6.2 lakh | 16% |
| September | ₹6.4 lakh | 13% |
Sales are increasing, but the margin is declining.
Possible reasons may include:
- Increased purchase costs
- Higher discounts
- Supplier price changes
- Incorrect selling prices
- Promotional activity
- Product mix changes
Retailers should investigate the reason rather than assuming that higher sales automatically mean better performance.
9. Analyse Category-Wise Stock and Sales Together
Sales and margin analysis becomes more useful when combined with inventory information.
A category with high sales and low stock may require faster replenishment.
A category with low sales and high stock may indicate excess inventory.
Retailers can monitor:
- Opening stock
- Purchases
- Sales
- Closing stock
- Stock value
- Stock turnover
- Days of inventory
- Slow-moving stock
This helps connect sales performance with inventory decisions.
10. Track Category-Wise Stock Turnover
Stock turnover indicates how quickly inventory is being sold and replenished.
A category with strong sales and fast stock movement may deserve greater inventory availability.
A category with slow movement may require:
- Reduced purchasing
- Better product selection
- Promotional activity
- Supplier negotiation
- Assortment review
The goal is not simply to keep more stock. It is to maintain the right stock level based on actual demand.
11. Compare Category Performance Across Stores
For grocery businesses operating multiple outlets, category analysis can also be performed store by store.
For example:
| Category | Store A | Store B | Store C |
|---|---|---|---|
| Beverages | ₹4.2L | ₹3.1L | ₹5.4L |
| Personal Care | ₹2.8L | ₹3.9L | ₹3.2L |
| Packaged Foods | ₹5.1L | ₹4.7L | ₹6.2L |
The differences can help retailers understand local demand patterns.
A category performing strongly in one store may not perform equally well in another because of differences in customer demographics, location, competition and purchasing behaviour.
12. Use Sales Trends to Improve Purchasing Decisions
Historical category data can help retailers make more informed purchase decisions.
Retailers can compare:
- Previous month sales
- Previous year sales
- Seasonal demand
- Current sales trends
- Promotional periods
- Stock availability
For example, beverage demand may rise during summer, while certain packaged food categories may see increased demand during festive periods.
Using historical and current sales data can help retailers plan inventory more effectively.
13. Monitor Category Contribution to Total Sales
Category contribution shows how much each category contributes to overall store revenue.
The formula is:
Category Sales Contribution % = Category Sales ÷ Total Store Sales × 100
For example, if total monthly sales are ₹50 lakh and beverages contribute ₹7.5 lakh:
Category Contribution = ₹7.5 lakh ÷ ₹50 lakh × 100 = 15%
This helps retailers identify their most important revenue-generating categories.
14. Identify Categories That Consume Working Capital
High inventory value does not always mean high profitability.
A category may have substantial stock value but generate relatively low sales. This means working capital remains tied up in inventory.
Retailers should identify categories with:
- High stock value
- Low sales velocity
- Low margins
- High ageing
- Low stock turnover
These categories may require assortment changes or tighter purchasing controls.
15. Build a Category Performance Dashboard
Instead of reviewing multiple reports separately, retailers can bring important metrics into one dashboard.
A useful category performance dashboard can include:
| Metric | What It Shows |
|---|---|
| Category Sales | Revenue generated |
| Units Sold | Product movement |
| Gross Profit | Profit contribution |
| Gross Margin % | Profitability |
| Discount Value | Promotional impact |
| Stock Value | Capital tied in inventory |
| Stock Turnover | Inventory movement |
| Sales Contribution % | Category importance |
| Slow-Moving Stock | Inventory risk |
A dashboard makes it easier for store managers and business owners to identify changes and take action quickly.
What Should Grocery Retailers Do With Category Analysis?
Category analysis is useful only when the insights lead to business decisions.
Retailers can use the findings to:
Increase Stock of Strong Performers
Maintain availability of categories and products that consistently generate sales and healthy margins.
Review Low-Margin Categories
Check purchase prices, selling prices, discounts and product mix.
Reduce Slow-Moving Inventory
Avoid repeatedly purchasing products that are not moving at the expected rate.
Improve Product Assortment
Add products that customers are actively purchasing and reconsider products with consistently weak performance.
Plan Better Promotions
Use category and product-level margin data to identify promotions that can increase sales without unnecessarily reducing profitability.
Negotiate With Suppliers
Sales volume and purchase data can provide a stronger basis for discussions around pricing, schemes and procurement terms.
How Technology Makes Category-Wise Analysis Easier
For a grocery retailer managing hundreds or thousands of SKUs, calculating category-wise sales and margins manually can consume significant time.
An integrated retail system can connect billing, sales, inventory and purchase data so that retailers can analyse business performance from a common data source.
Depending on the system, retailers can track:
- Category-wise sales
- Product-wise sales
- Gross margins
- Purchase costs
- Stock levels
- Slow-moving products
- Fast-moving products
- Discounts
- Store-wise performance
- Customer buying trends
- Inventory turnover
A grocery retailer looking to improve this level of visibility can explore Grocery POS Software that connects everyday billing and sales activity with inventory and business reporting.
Key Metrics Grocery Retailers Should Review Regularly
A practical category-performance review can focus on these metrics:
| Metric | Why It Matters |
|---|---|
| Category Sales | Measures revenue |
| Gross Profit | Measures profit contribution |
| Gross Margin % | Shows profitability |
| Units Sold | Measures demand |
| Average Selling Price | Tracks price movement |
| Discount % | Shows promotional impact |
| Stock Value | Indicates working capital |
| Stock Turnover | Measures inventory movement |
| Sales Contribution | Shows category importance |
| Slow-Moving Stock | Highlights inventory risk |
Retailers can review these metrics daily for operational monitoring and weekly or monthly for broader business analysis.
Conclusion
Category-wise sales and margin analysis gives grocery retailers a clearer understanding of how different parts of the business are performing.
Instead of looking only at total revenue, retailers can evaluate sales, units, margins, discounts, inventory and profitability at category and product level. This makes it easier to identify profitable categories, control low-margin products, reduce slow-moving inventory and improve purchasing decisions.

As grocery businesses grow and SKU counts increase, connected sales, inventory and reporting systems can make this analysis faster and more consistent. The objective is not simply to sell more products, but to understand which products and categories generate sustainable revenue and profit.
Call at +9173411-41176/75 or send us an email at sales@logicerp.com to book a free demo today!
FAQs
1. How Can Grocery Retailers Analyse Category-Wise Sales?
Retailers can group products into categories and compare sales value, units sold, sales contribution, margins and inventory movement for each category.
2. How Do You Calculate Category-Wise Gross Margin?
Gross margin percentage can be calculated using:
Gross Margin % = (Net Sales − Cost of Goods Sold) ÷ Net Sales × 100
3. Which Grocery Categories are Usually More Profitable?
Profitability varies by retailer, product mix, location, supplier pricing and competition. Instead of assuming that one category is always more profitable, retailers should analyse their own sales and cost data.
4. Why Should Retailers Track Both Sales and Margins?
Sales show revenue, while margins show profitability. A category can generate high sales but contribute relatively little profit if its margin is low.
5. How Can Category Analysis Improve Grocery Inventory Management?
Category analysis helps retailers identify fast-moving and slow-moving products, understand demand patterns and align purchasing with actual sales performance.
6. How Can Retailers Identify Low-Margin Categories?
Compare category-level sales, purchase costs, discounts and gross margins over time. A category with increasing sales but declining margins requires closer investigation.
7. How Often Should Grocery Retailers Analyse Category Performance?
Daily reports can help with operational monitoring, while weekly and monthly analysis can reveal trends, margin changes, inventory issues and category-level performance patterns.
8. Can Technology Automate Category-Wise Sales Analysis?
Yes. Integrated retail systems can consolidate sales, purchase and inventory data and generate category-wise reports and dashboards, reducing the need for manual calculations.

Author
Gurbir Singh
Co-founder & Managing Director | LOGIC ERP Solutions Pvt. Ltd.
With 30+ years of experience in the tech industry, I took the helm of technology & product development, ensuring LOGIC ERP’s continuous innovation & leadership in the evolving tech landscape.