Mastering Stock Turnover Ratio Formula: Efficient Inventory Management

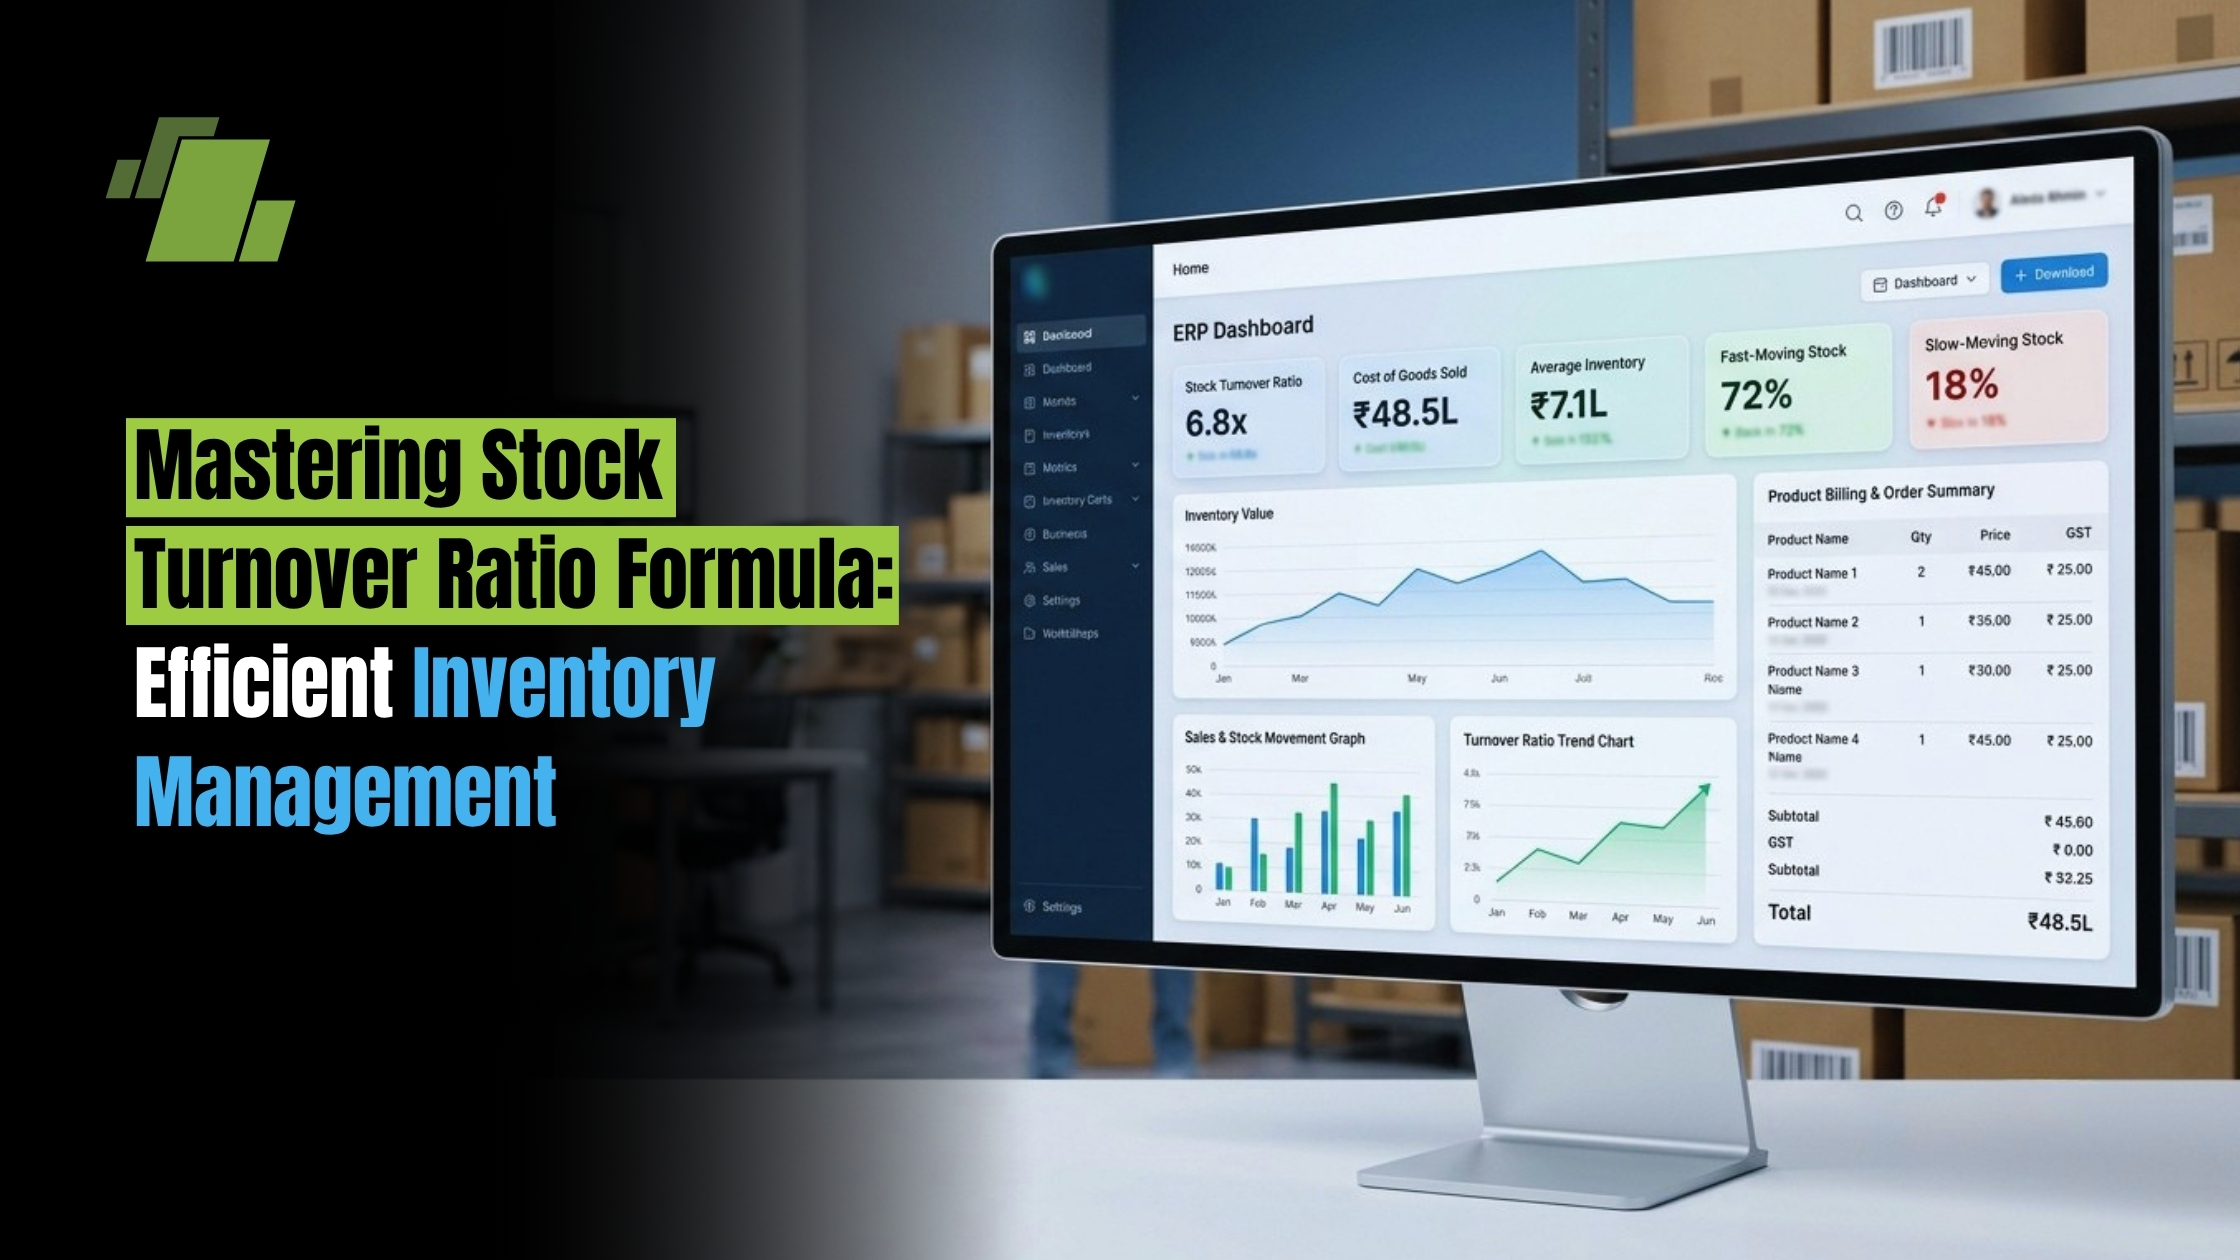
The stock turnover ratio helps a business understand how efficiently it sells and replaces inventory during a period. In simple terms, it connects the cost of goods sold with the average stock held, giving managers, students, and business owners a practical view of inventory movement. This guide explains the stock turnover ratio formula, its meaning, examples, related day-based formulas, and how to interpret the result without overcomplicating the accounting.
Contact Us
Free Demo Request
Key Takeaway
The stock turnover ratio formula is a practical tool for understanding how efficiently inventory moves through a business. Whether you call it stock turnover ratio, inventory turnover ratio, or rate of stock turnover formula, the core calculation is cost of goods sold divided by average stock.
To make the result more useful, convert it into inventory turnover days using 365 divided by the ratio. Then interpret it in context: the ideal inventory turnover ratio depends on the industry, product type, and business strategy. Used carefully, this simple ratio helps businesses reduce waste, improve cash flow, and keep inventory aligned with real demand.
What does the Stock Turnover Ratio Mean?
Stock turnover ratio meaning is straightforward: it shows how many times inventory is sold and replaced during an accounting period. The same idea is often called inventory turnover ratio, inventory turnover, or simply stock turnover. When you define stock turnover, think of it as the speed at which goods move through the business instead of sitting in storage.
The inventory turnover ratio meaning is especially useful because inventory ties up money. If stock moves too slowly, cash may be locked in unsold goods, storage costs may rise, and products may become outdated. If stock moves too quickly, the business may face shortages, missed sales, or rushed purchasing decisions.
In accounting language, the stock turnover definition focuses on the relationship between cost of goods sold and average inventory. So, when someone asks what does inventory turnover ratio indicate, the answer is that it indicates the efficiency of inventory management, sales performance, and purchasing control.
The Core Stock Turnover Ratio Formula
The basic stock turnover ratio formula is:
Stock Turnover Ratio = Cost of Goods Sold / Average Stock
This is also the main inventory turnover ratio formula and inventory turnover formula used in most accounting explanations. In other words, the stock turnover ratio is equal to divided by average stock when the numerator is cost of goods sold. More clearly, it is cost of goods sold divided by average stock.
Average stock is calculated as:
Average Stock = (Opening Stock + Closing Stock) / 2
Cost of goods sold is usually calculated as:
Cost of Goods Sold = Opening Stock + Purchases + Direct Expenses – Closing Stock
In some school-level or basic business contexts, sales may be used when cost of goods sold is not available. However, cost of goods sold gives a more accurate result because inventory is recorded at cost, not selling price.
The rate of stock turnover formula is another way to describe the same ratio. It measures the rate at which stock is converted into sales during the period.
How to Calculate Inventory Turnover Ratio?
To calculate inventory turnover ratio, divide the cost of goods sold by average inventory for the same period. This answers both how to calculate inventory turnover ratio and how to calculate stock turnover ratio because the terms are often used interchangeably. The key is to use matching period figures, such as annual cost of goods sold with annual average stock.
Follow these steps:
- Find opening stock at the beginning of the period.
- Find closing stock at the end of the period.
- Calculate average stock by adding opening and closing stock, then dividing by two.
- Calculate cost of goods sold using purchases, direct expenses, and stock figures.
- Apply the turnover ratio formula by dividing cost of goods sold by average stock.
- Interpret the result in relation to business type, product category, and past performance.
For example, suppose a business has opening stock of $40,000, closing stock of $60,000, and cost of goods sold of $250,000.
Average stock is:
($40,000 + $60,000) / 2 = $50,000
The inventory turnover ratio is:
$250,000 / $50,000 = 5 times
This inventory turnover ratio example shows that the business sold and replaced its average inventory five times during the period. As a stock turnover ratio example, it also suggests that inventory is moving regularly, though whether that is good depends on the industry and business model.

Stock Turnover Ratio in Days
The ratio itself tells you how many times inventory turns over, but many people also want to know how long stock remains in the business. That is where inventory turnover days, inventory turnover ratio in days, and the stock turnover ratio formula in days become useful.
The common formula is:
Inventory Turnover Days = 365 / Inventory Turnover Ratio
You may also see the inventory holding period formula written as:
Inventory Holding Period = Average Stock / Cost of Goods Sold × 365
Both formulas explain the same idea: the average number of days inventory is held before being sold. If the stock turnover ratio is 5 times, then inventory turnover days are:
365 / 5 = 73 days
This means the business holds inventory for about 73 days on average. A shorter period may indicate faster sales and better liquidity, while a longer period may suggest slow-moving stock. However, the right result depends heavily on the nature of the products. A grocery business and a furniture business will not usually have the same inventory holding period.
Inventory Turnover Ratio Formula Class 12 Explained
For students, the inventory turnover ratio formula class 12 is usually presented as part of ratio analysis. It helps evaluate operating efficiency by showing how quickly stock is converted into revenue through sales. In many Class 12 accountancy contexts, the formula is taught as:
Inventory Turnover Ratio = Cost of Revenue from Operations / Average Inventory
Average inventory is calculated as:
(Opening Inventory + Closing Inventory) / 2
If cost of revenue from operations is not directly given, students may need to calculate it from available information. If the question gives only revenue from operations and not cost, some textbooks or exam questions may allow a simplified version, but the cost-based formula is preferred when possible.
A simple exam-style approach is:
- Write the correct inventory turnover ratio formula.
- Calculate average inventory clearly.
- Substitute the values step by step.
- Express the answer in “times.”
- If asked for days, use 365 divided by the ratio.
This keeps the working neat and reduces mistakes, especially when several ratios are being calculated in the same question.
What is a Good Inventory Turnover Ratio?
A good inventory turnover ratio is one that fits the business model, product type, customer demand, and supply chain. There is no single ideal inventory turnover ratio for every business because fast-moving consumer goods, luxury items, seasonal goods, and industrial products all behave differently. The ideal stock turnover ratio is best judged against past performance, industry patterns, and the company’s ability to meet demand without overstocking.
Generally, a higher stock turnover ratio suggests that stock is selling quickly. This can be positive because it may reduce storage costs, improve cash flow, and lower the risk of obsolete inventory. But an extremely high turnover ratio can also be a warning sign if the business is understocked or frequently unable to fulfill orders.
A low stock turnover ratio may suggest slow sales, excess inventory, poor purchasing decisions, or weak demand. Still, it is not automatically bad. Some businesses intentionally hold higher inventory to manage long supply times, seasonal demand, or specialized customer needs.
A practical way to judge the result is to ask:
- Is the ratio improving or worsening compared with previous periods?
- Are stockouts happening often?
- Is inventory becoming outdated, damaged, or difficult to sell?
- Are storage and holding costs increasing?
- Does the ratio match the normal sales cycle of the product?
- Are purchasing decisions based on real demand or guesswork?
These questions make the ratio more useful than simply labeling it “high” or “low.”
What Inventory Turnover Ratio Evaluates in a Business
Inventory turnover ratio evaluates how effectively a business manages the movement of goods. It connects purchasing, sales, warehousing, pricing, and demand planning in one simple number. Because inventory affects cash flow, profitability, and customer satisfaction, this turnover ratio can support better everyday decisions.
For business owners, the ratio can highlight whether too much money is tied up in stock. For finance teams, it can support working capital analysis. For operations teams, it can reveal whether ordering cycles need adjustment. For sales teams, it may show whether certain products are moving as expected or need promotional support.
The ratio becomes more powerful when used with other information, such as gross profit margin, sales trends, reorder levels, and seasonal patterns. A high inventory turnover ratio with falling margins may mean goods are selling quickly because of heavy discounting. A low ratio with strong margins may be acceptable if products are specialized and sell at a premium.
Common Mistakes When using the Stock Turnover Formula
The stock turnover formula is simple, but interpretation errors are common. The first mistake is mixing cost figures with selling price figures. Since average stock is normally valued at cost, cost of goods sold should be used for a more consistent calculation.
Another mistake is comparing businesses that are not similar. A pharmacy, electronics retailer, car dealer, and clothing store may all have very different stock movement patterns. The same turnover ratio formula can be used, but the interpretation should change with the context.
Avoid these common issues:
- Using closing stock instead of average stock: Closing stock alone may not represent inventory levels across the full period.
- Ignoring seasonal changes: A business may hold more stock before peak seasons, which can affect the ratio.
- Assuming higher is always better: Very high turnover may point to insufficient inventory.
- Using the ratio without days: Inventory turnover days often make the result easier to understand.
- Skipping product-level analysis: Overall inventory turnover can hide slow-moving items within a strong total result.
The best use of the stock turnover ratio is not just calculation, but diagnosis. It should help explain what is happening and what action may be needed.
Practical Ways to Improve Stock Turnover
Improving stock turnover means finding the right balance between availability and efficiency. The goal is not to reduce inventory at any cost, but to keep the right products moving at the right pace.
Useful actions include:
- Review slow-moving items regularly. Identify products that stay in storage too long and decide whether to discount, bundle, reorder less, or discontinue them.
- Forecast demand more carefully. Use sales history, seasonal trends, and customer behavior instead of relying only on instinct.
- Set smarter reorder levels. Reorder points should reflect lead time, sales speed, and safety stock needs.
- Improve supplier coordination. Reliable suppliers can help reduce the need to hold excessive stock.
- Segment inventory by performance. Fast-moving products may need frequent replenishment, while slow-moving products need tighter control.
- Monitor inventory turnover ratio in days. Days-based tracking makes it easier to see how long capital remains tied up in stock.
These steps make the formula actionable. Instead of calculating the ratio once and filing it away, businesses can use it to guide purchasing, pricing, and stock control decisions.

Call at +91-73411-41176/75 or send us an email at sales@logicerp.com to book a free demo today!
Frequently Asked Questions
1. What is the Stock Turnover Ratio?
The stock turnover ratio shows how many times a business sells and replaces its average inventory during a specific period.
2. What is the Stock Turnover Ratio Formula?
The formula is:
Stock Turnover Ratio = Cost of Goods Sold ÷ Average Stock
3. How do you Calculate Average Stock?
Average stock is calculated using:
Average Stock = (Opening Stock + Closing Stock) ÷ 2
4. What does a High Stock Turnover Ratio Mean?
A high ratio generally indicates that inventory is selling quickly. However, an extremely high ratio may also suggest understocking or frequent stockouts.
5. How do you Calculate Inventory Turnover Days?
Inventory turnover days can be calculated using:
Inventory Turnover Days = 365 ÷ Inventory Turnover Ratio
This shows the average number of days inventory remains in the business before being sold.

Author
Gurbir Singh
Co-founder & Managing Director | LOGIC ERP Solutions Pvt. Ltd.
With 30+ years of experience in the tech industry, I took the helm of technology & product development, ensuring LOGIC ERP’s continuous innovation & leadership in the evolving tech landscape.